Getting started with benchmarks reports
You will learn
Learn how benchmarks allow you to analyze your account data in relation to Klaviyo best practices, industry trends, and companies similar to your own. By seeing how different aspects of your account perform, you can prioritize efforts in areas that need improvement in order to use Klaviyo to its maximum potential.
Benchmarks prerequisites
Email In order to see benchmarks, you must meet our eligibility requirement of having sent at least 25 emails in the last six months. Any account that provides its industry will be able to see industry-level benchmarks. Benchmarks are updated with new data on the 10th of every month. You will see a timestamp of when your benchmarks were last updated in the upper right. If you become eligible for benchmarks this month, your benchmarks will not be available until next month.
SMS
Similar to email, SMS campaign benchmarks require that you have sent at least 25 SMS messages. You will be unable to see industry data in SMS campaign benchmarks if you do not meet this eligibility criteria. This article explains the different benchmarking pages and how to read them. For information on how to customize the tables and graphs in each page, head to How to customize your benchmark pages. For strategic guidance on using your Analytics tab, head to our course on Customizing your analytics experience.
Determining your industry
When navigating into the different benchmarks pages, you will see a section at the bottom of each page noting how we determine your benchmarks comparison data. By clicking into this section, you can review what industry is currently being used to derive your peers' data, as shown below.
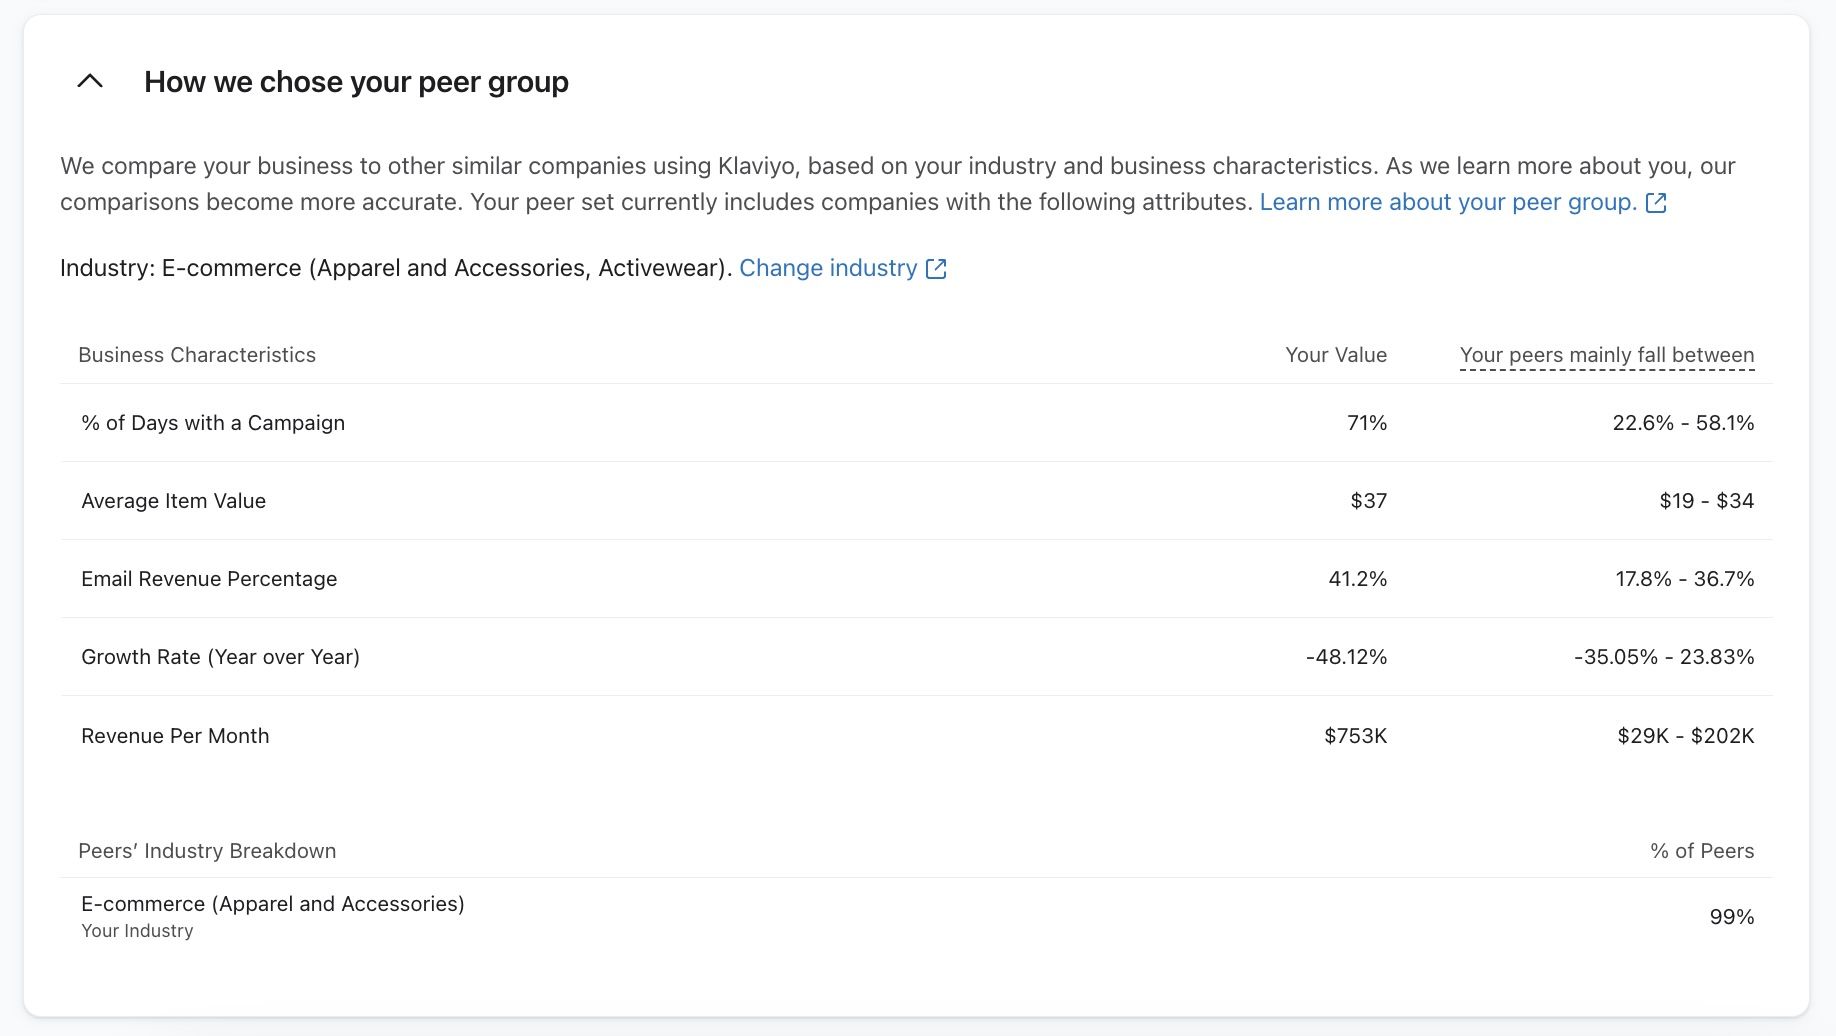
Peer groups are a set of roughly one hundred companies that are similar to your own in size and scope (e.g., industry, average item value, total revenue, year over year growth rate, percent of days with a campaign sent and email revenue percentage). If you have not set your industry or your industry is inaccurately captured, you can adjust this by visiting Organization > Contact Information. For details on how to update this organizational information, head to How to update your industry and vertical in Klaviyo.
Accessing benchmarks
1. To access benchmarks, head to the Analytics > Benchmarks
Within the benchmarks tab, there are 5 separate pages that allow you to analyze your data in relation to other companies similar to your own. These pages include:
- Overview
- Business performance
- Campaigns
- Flows
- Sign-up forms
With the release of iOS15, macOS Monterey, iPadOS 15, and WatchOS 8, Apple Mail Privacy Protection (MPP) changed the way that we receive open rate data on your emails by prefetching our tracking pixel. With this change, it’s important to understand that open rates will be inflated.
To see if your opens are affected, we suggest creating a custom report that includes an MPP property. You can also identify these opens in your individual subscriber segments.
Benchmarks overview page
When you select Benchmarks, you will arrive at the Overview page by default. The overview page displays a quick summary of what aspects of your marketing program are performing well and what aspects are performing poorly.
Unlike other Klaviyo reports, in benchmark reports, Average Order Count numbers are totaled until whatever end date you choose. For example, if you are looking at Average Order Count from last month, it will be the total number until last month.
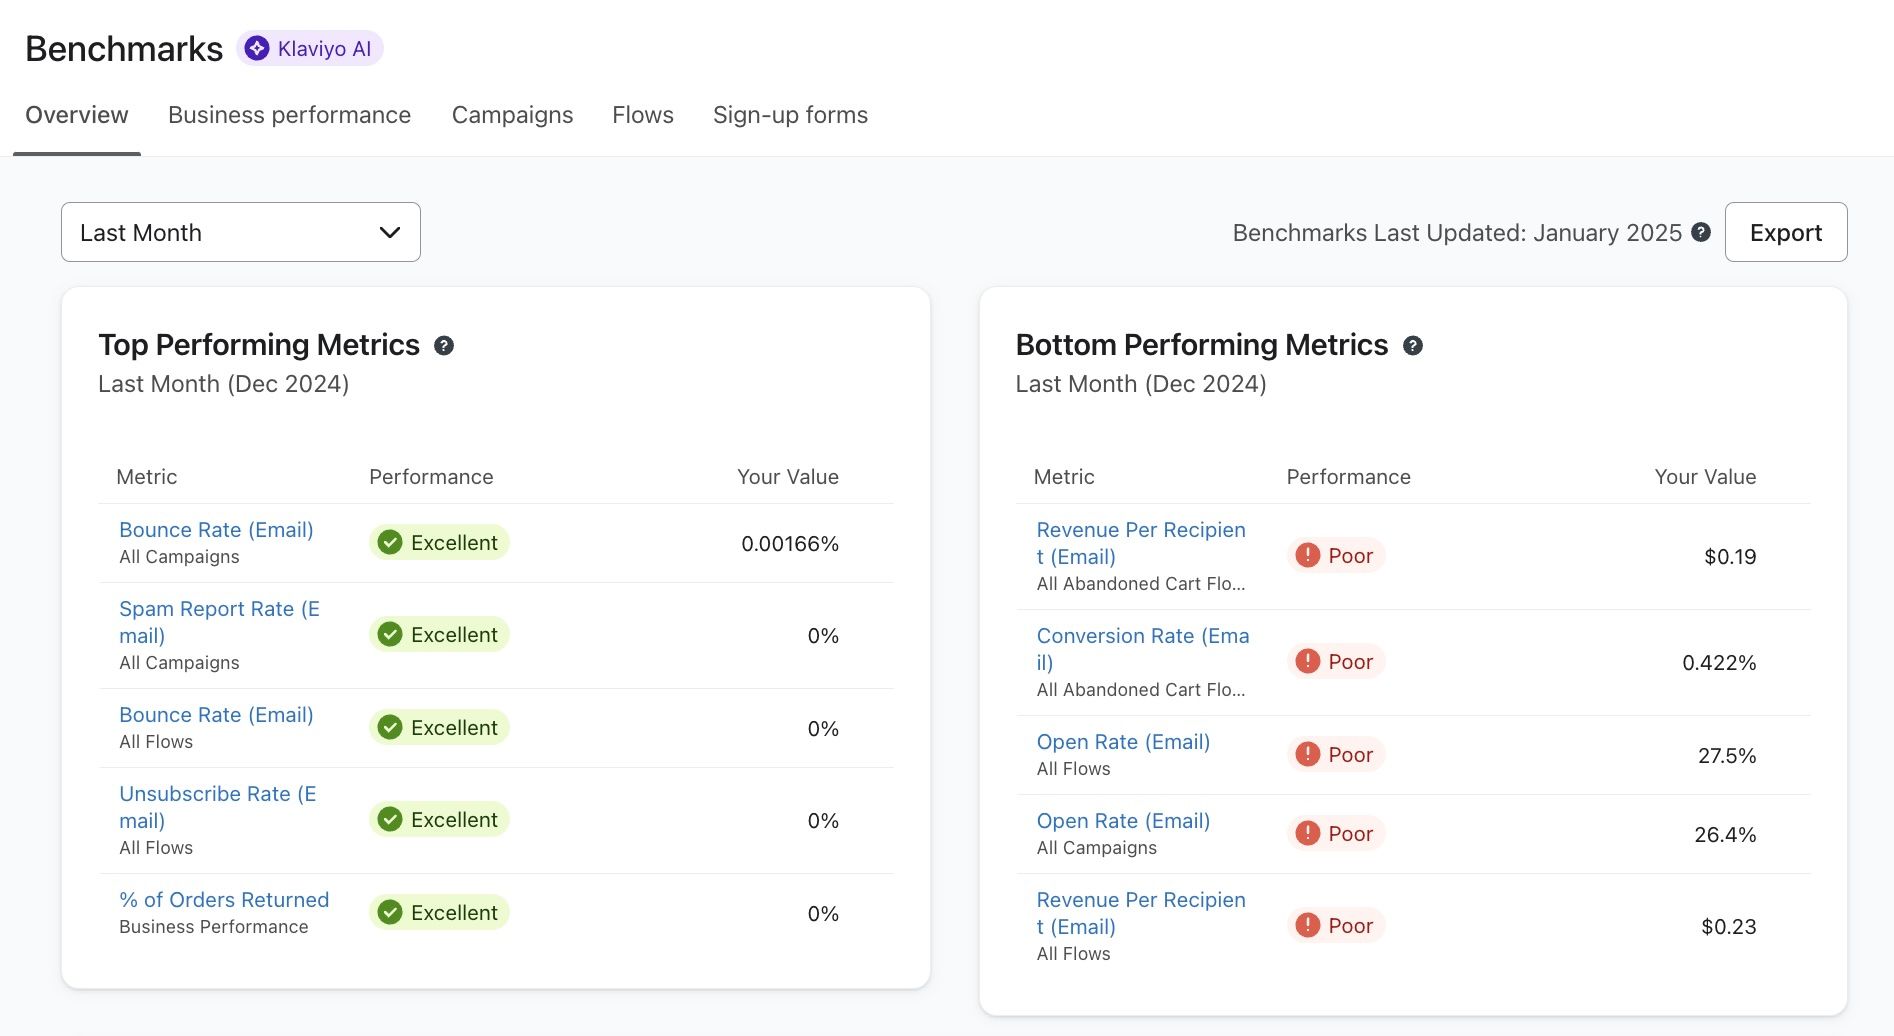
The Top Performing Metrics section displays your top-most metrics, ranked in order of decreasing percentiles. Meanwhile, your Bottom Performing Metrics shows your bottom five performing metrics, ranked in order of increasing percentiles. Both tables will also show the raw output values of each of your performance metrics.
Understanding how the data is organized in benchmarks
The Business performance, Campaigns, Flows, and Sign-up forms pages allow you to dig deeper into more specific data for a focused analysis. To navigate into any of these, click on the associated tab.
In any of these pages, you will see a graph and table of data trends across different performance indicators over time. They also include the same two display options for your data either in a bar chart or line chart.
Tables
The default table view summarizes account performance for the entire time period selected per metric. This view is helpful in that it provides a raw value for each metric, as well as a visual performance indicator.
Standard view
Upon landing on any table view, you will automatically see the following columns and values:
- Metric
The metrics we've chosen that represent the performance of your account. Examples include open rate, click rate, and repeat customer rate. - Your Performance
Connotes how well each performance indicator has functioned in relation to your peer group. These statuses are poor, fair, good, and excellent. Learn more about what benchmarks performance data means and how to use it. - Your Value
The raw amount equated to the given performance indicator; e.g., for average order value, you will see that exact monetary value for your business. - Median (Peers)
The value attributed to companies in the middle tier of performance. Half of the companies perform better than the median, and half perform worse.
Detailed table view
To view additional values and performance indicators associated with your metric, toggle on the option for Detailed View on the upper right side above the table.
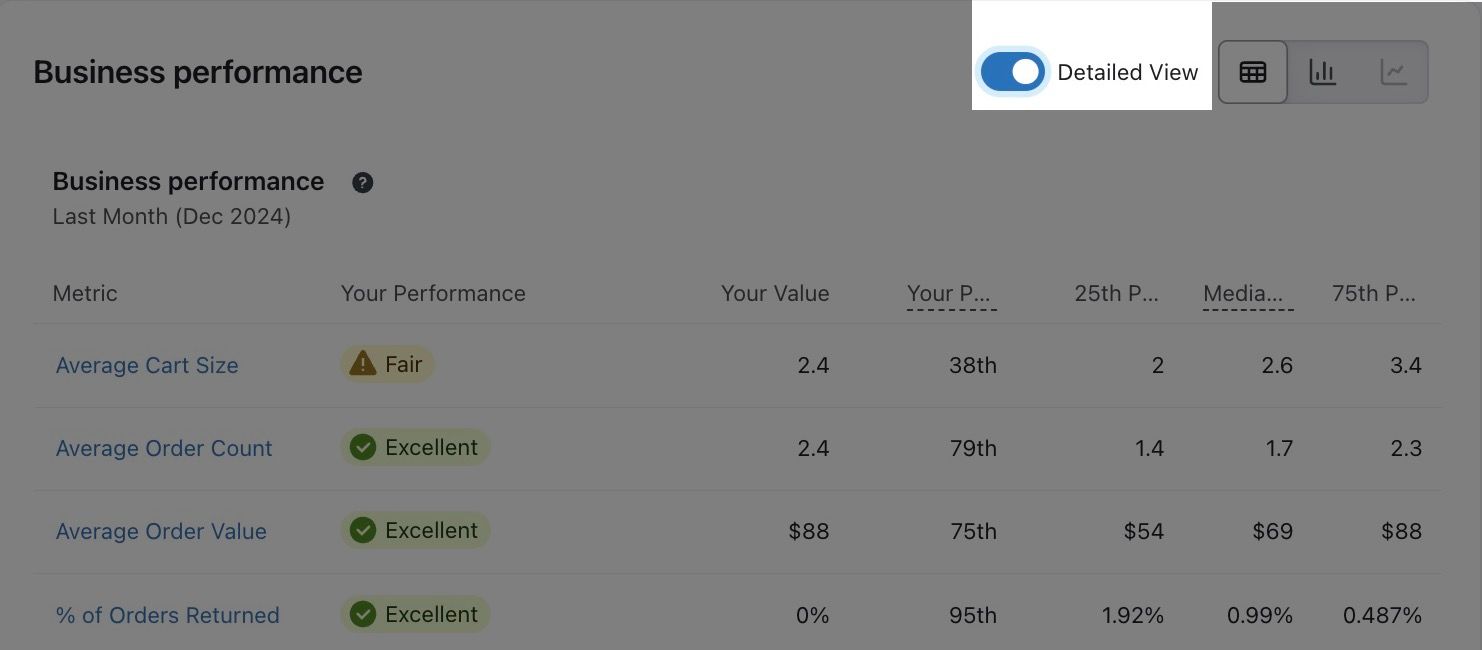
Once this has been toggled on, you will see the following additional performance indicators populate in the table including:
- Your Percentile
Where you rank in relation to your peers within your designated peer group. For example, if you are in the 75th percentile, your company ranked higher than 75% of other similar companies. We report the 25th, 50th (median), and 75th percentiles. - 25th Percentile
The value attributed to companies in the lowest tier of performance. - 75th Percentile
The value attributed to companies in the highest tier of performance.
Graphs
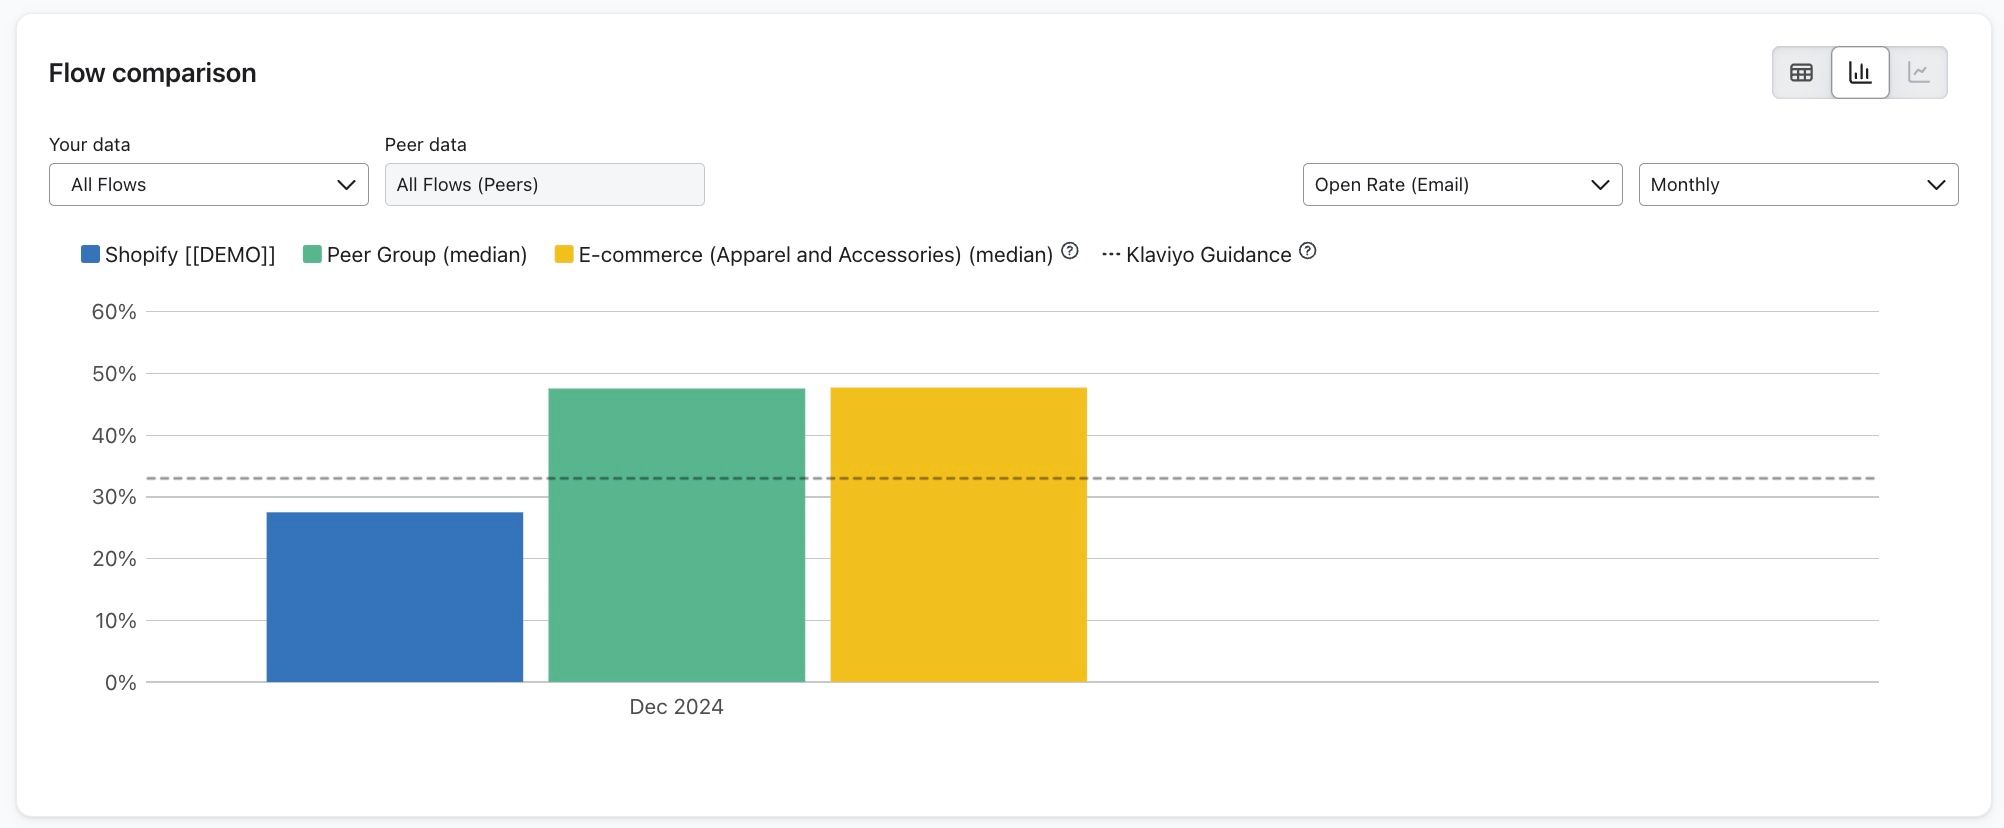
The different graphs available will show your own performance, the median performance of your industry, and the median performance of your peer group.
In each graph you will see different colors that represent different performance indicators including:
- Blue
Represents your own performance for that given metric. - Green
Represents the median performance of your peer group. - Yellow
Represents the median performance of your entire industry. - Dashed blue line
Where applicable, the dashed blue line represents Klaviyo guidance or best practices for values to hit.
The different chart styles include:
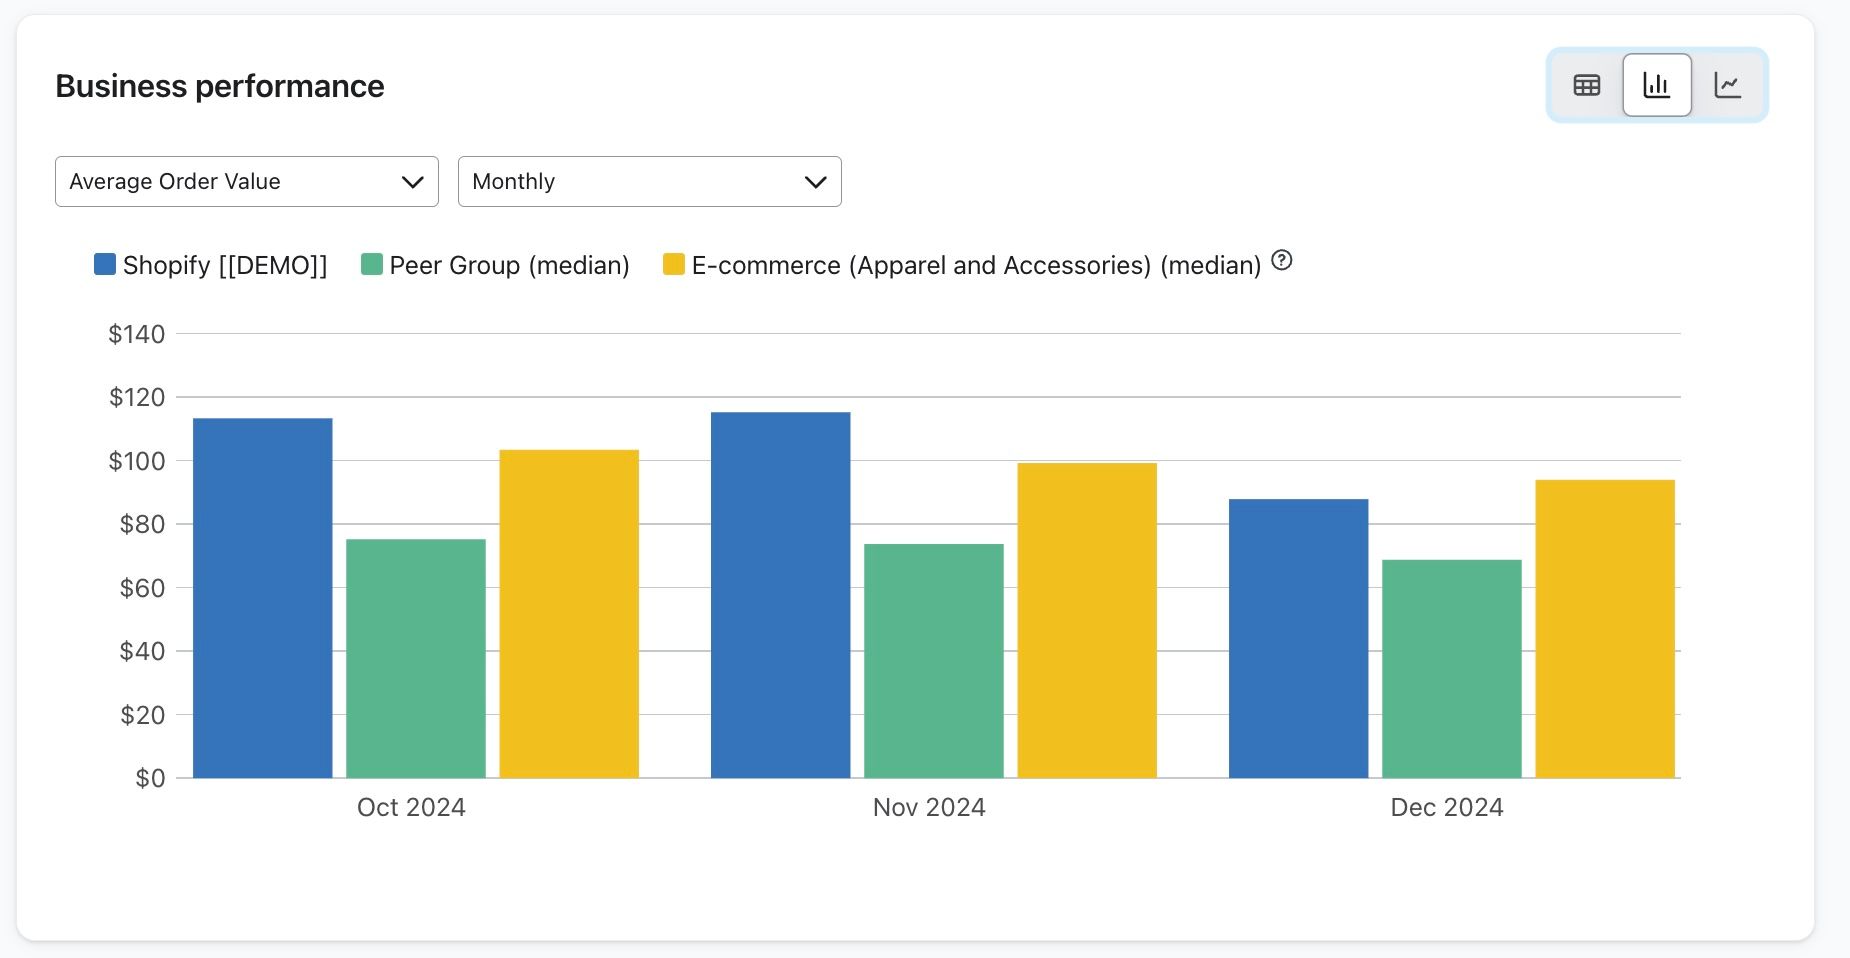
- Bar graph
In the bar graph, compare your rates in comparison to those of your peers and industry in bars lined up next to each other. Each bar grouping will display according to the time range you choose.
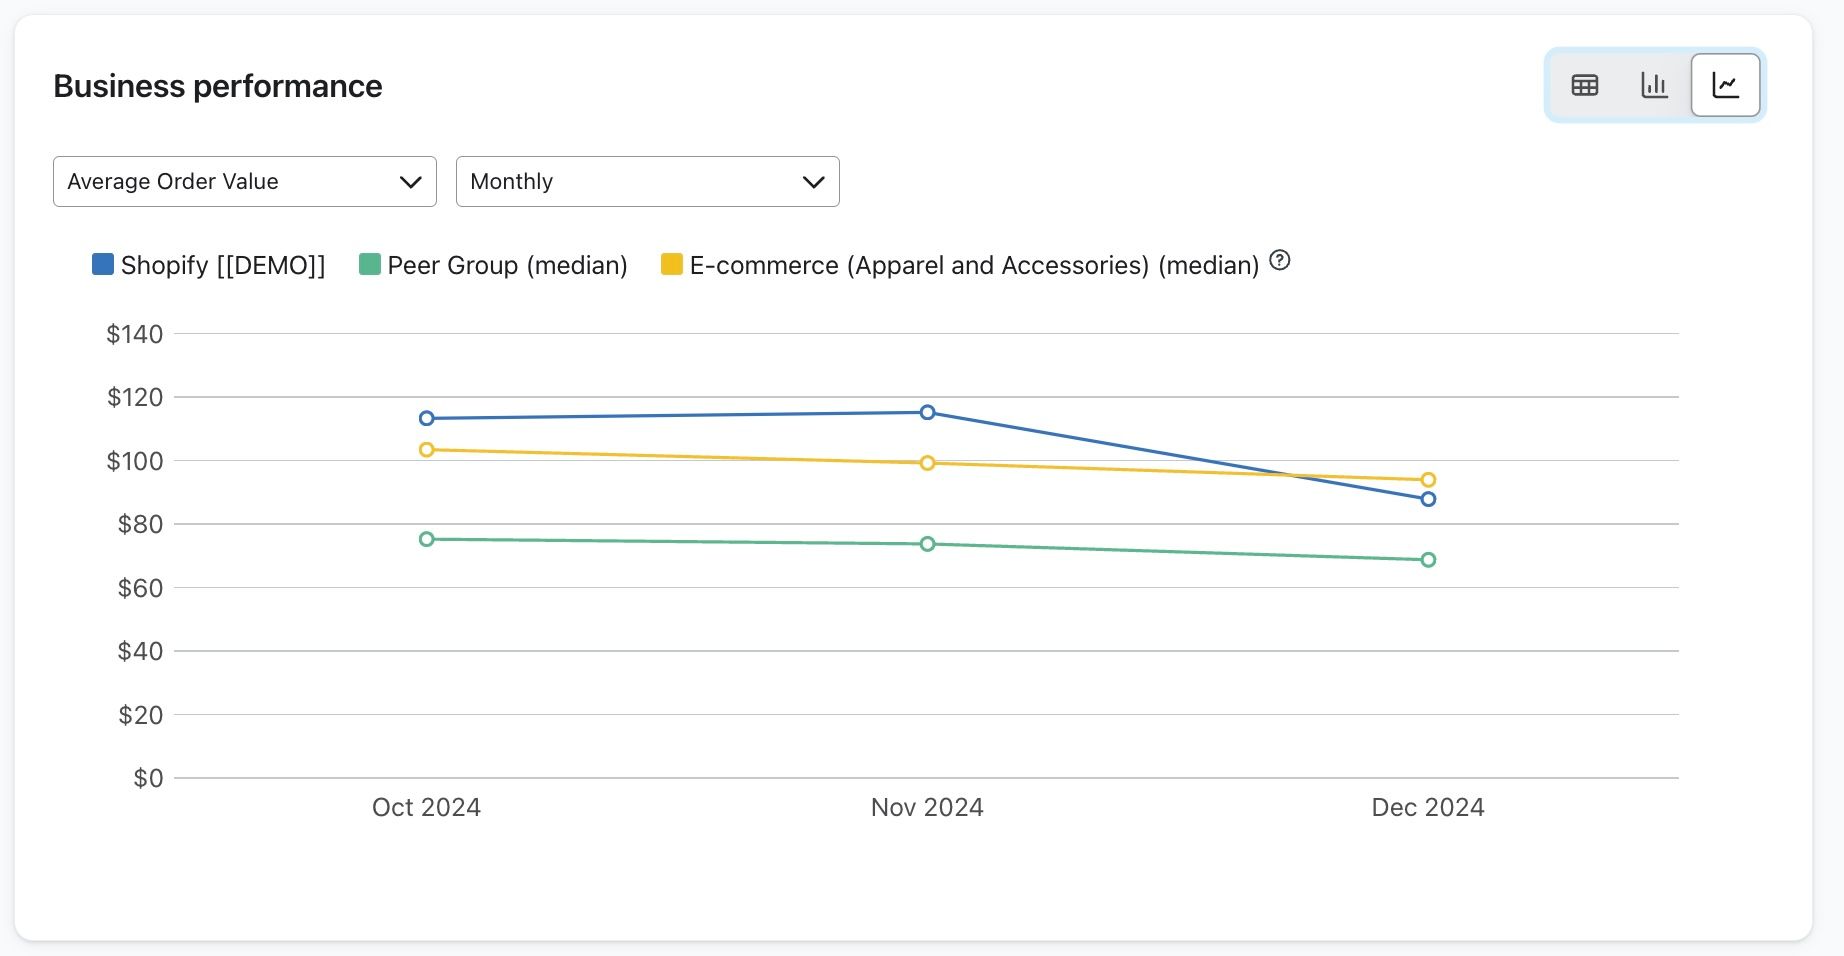
- Line graph
In the line graph, compare your trends over time in comparison to those of your peers and industry data. Each plot point represents the data for a given set of time (e.g., each month), and they connect to give a visualization of your results over time so that you can easily see where you rise or fall in performance. It’s important to note that you can only view the line chart if you are viewing more than one time period (e.g. multiple weeks in a quarter, months, or years).
How we calculate your rates
Rates in benchmarks’ data represent the averages over a specific time period (e.g., last month). These averaged benchmark rates include:
- Open rates
- Click rates
- Click through rate
- Placed order rate
- Email revenue per recipient
- Bounce rate
- Spam rate
- Unsubscribe rate
For example, say you are looking at your click rate metrics for the last quarter. If your first campaign has 50 deliveries and 25 recipients click, it would have a click rate of 50%. And say your second campaign has 100 deliveries, and only 20 recipients click, it would have a click rate of 20%.
Instead of averaging these together to get a click rate of 35%, we combine the data from both campaigns and then calculate the overall click rate. To do this, we take the clicks from the first campaign plus the clicks from the second campaign, divided by deliveries from the first campaign plus deliveries from the second campaign. In this case, this would look like click rate = (25+20)/(50+100) = 30%.
Using the business performance page
The business performance page provides a breakdown of key performance indicators pertaining to overall business health, so that you can monitor trends over time and focus on areas that need improvement. Here you will see a table, graph, and line chart outlining the areas of the business in which you excel and those that need to improve.
Displaying your data
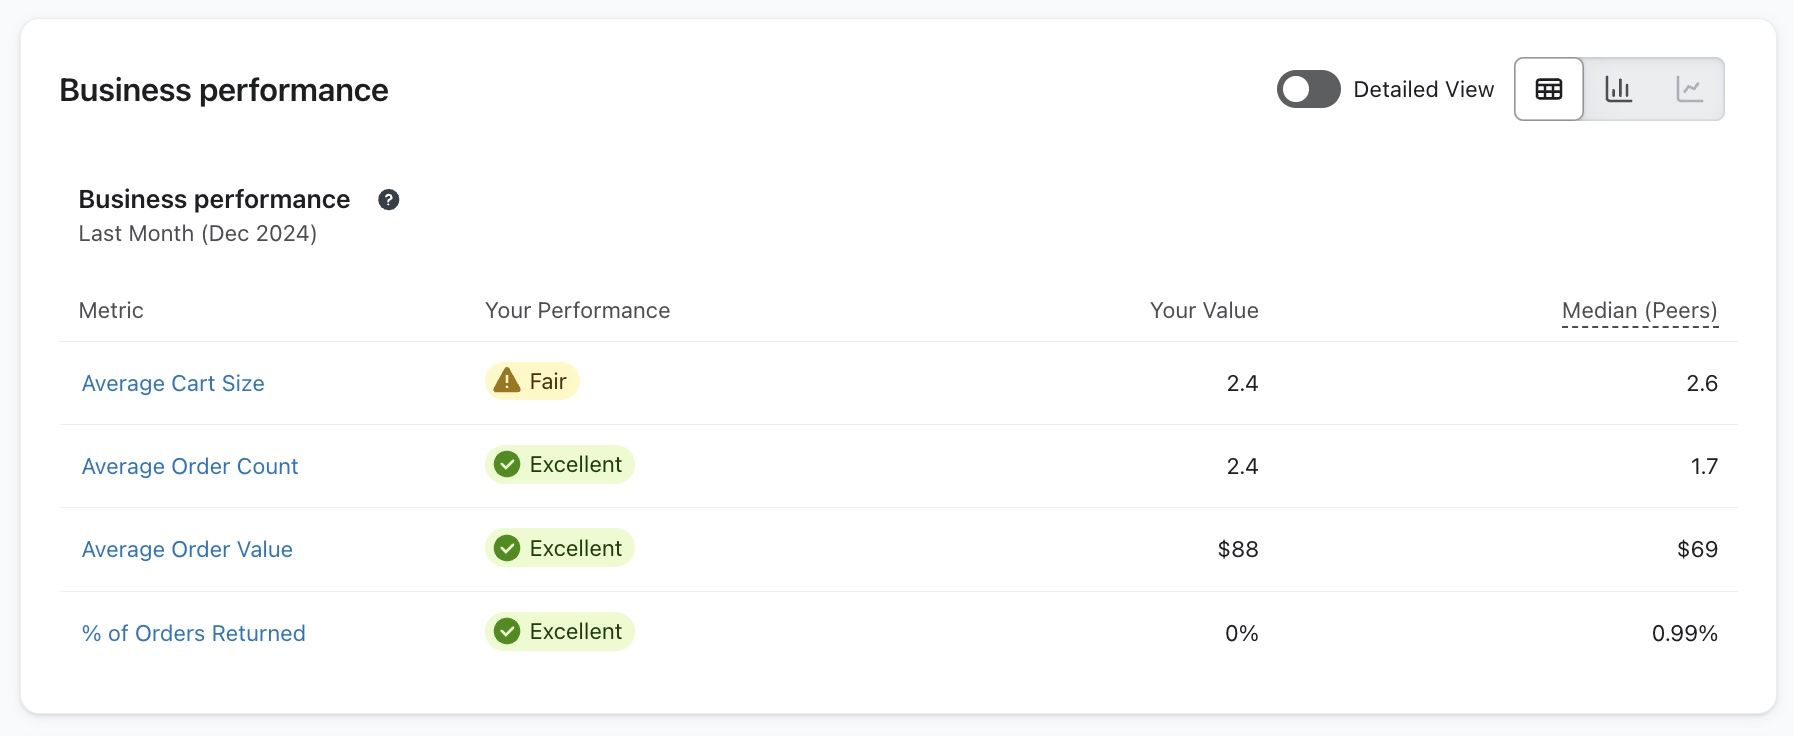
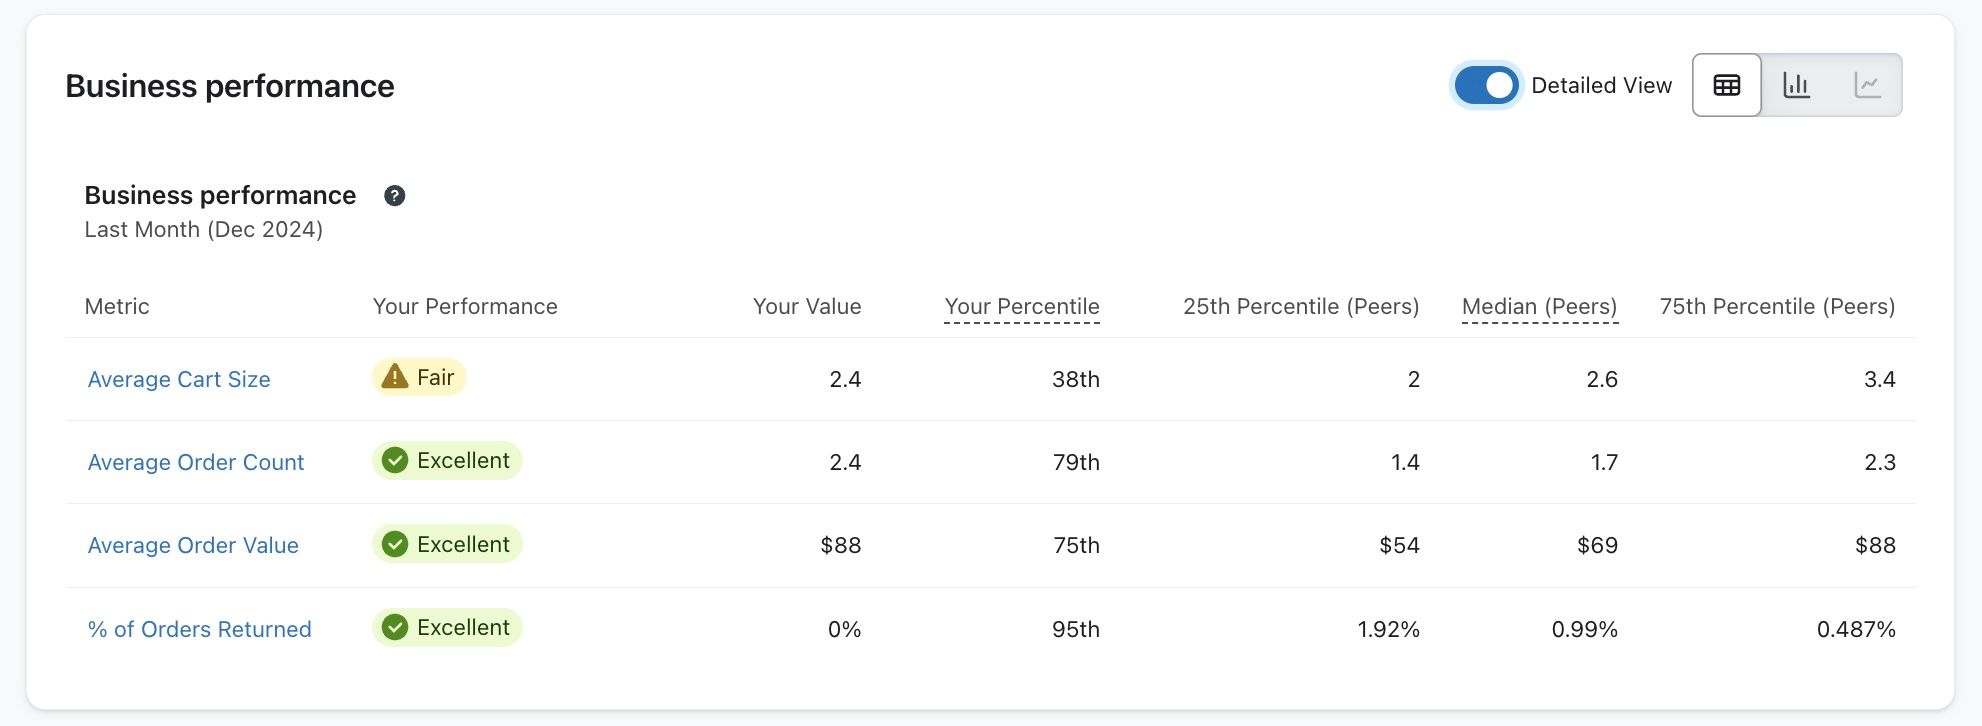
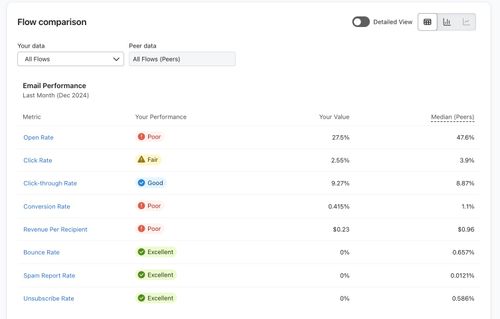
By default, your business performance page will show a standard table view as in the example below.
You can also choose to expose the data for percentiles by toggling the option for Detailed View in the upper right side.
Additional data display options
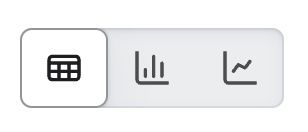
In the top-right corner of the table, you will see 3 options for viewing your data:
- Table
- Bar graph
- Line graph
You can toggle between the 3 options and view your data in the way that is most helpful to you. You will be shown the same data from the standard table view with all methods.
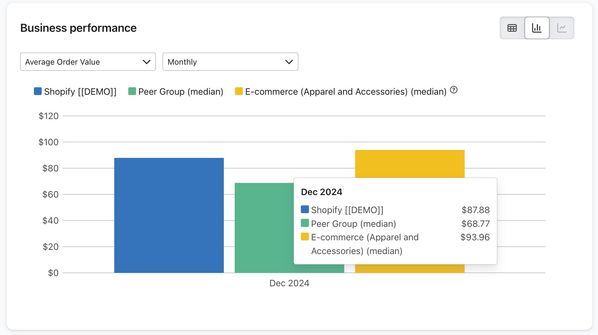
For the bar and line chart options, hover over the chart itself to see a breakdown of the data for your account, peer group, and industry. Additionally, you will see a status (Excellent, Good, Fair, or Poor) that rates your performance in comparison to Klaviyo best practices and your peer group.
Performance indicators and values
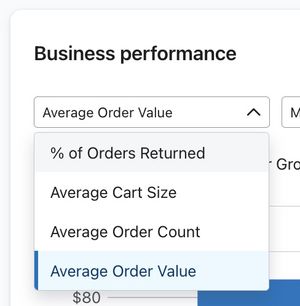
In the business performance table view, you will see data around the following performance indicators:
- Average cart size
Average number of items in your customers' carts during the time period selected. - Average order count
Average number of orders customers have made over all time up until the end of the period. selected - Average order value
Average US dollar value of carts during the time period selected. - % of orders returned
Percentage of orders where a return was made.
On the line chart and bar graph options, you will need to choose a specific performance indicator from the dropdown menu above the visualization.
Using the campaigns page
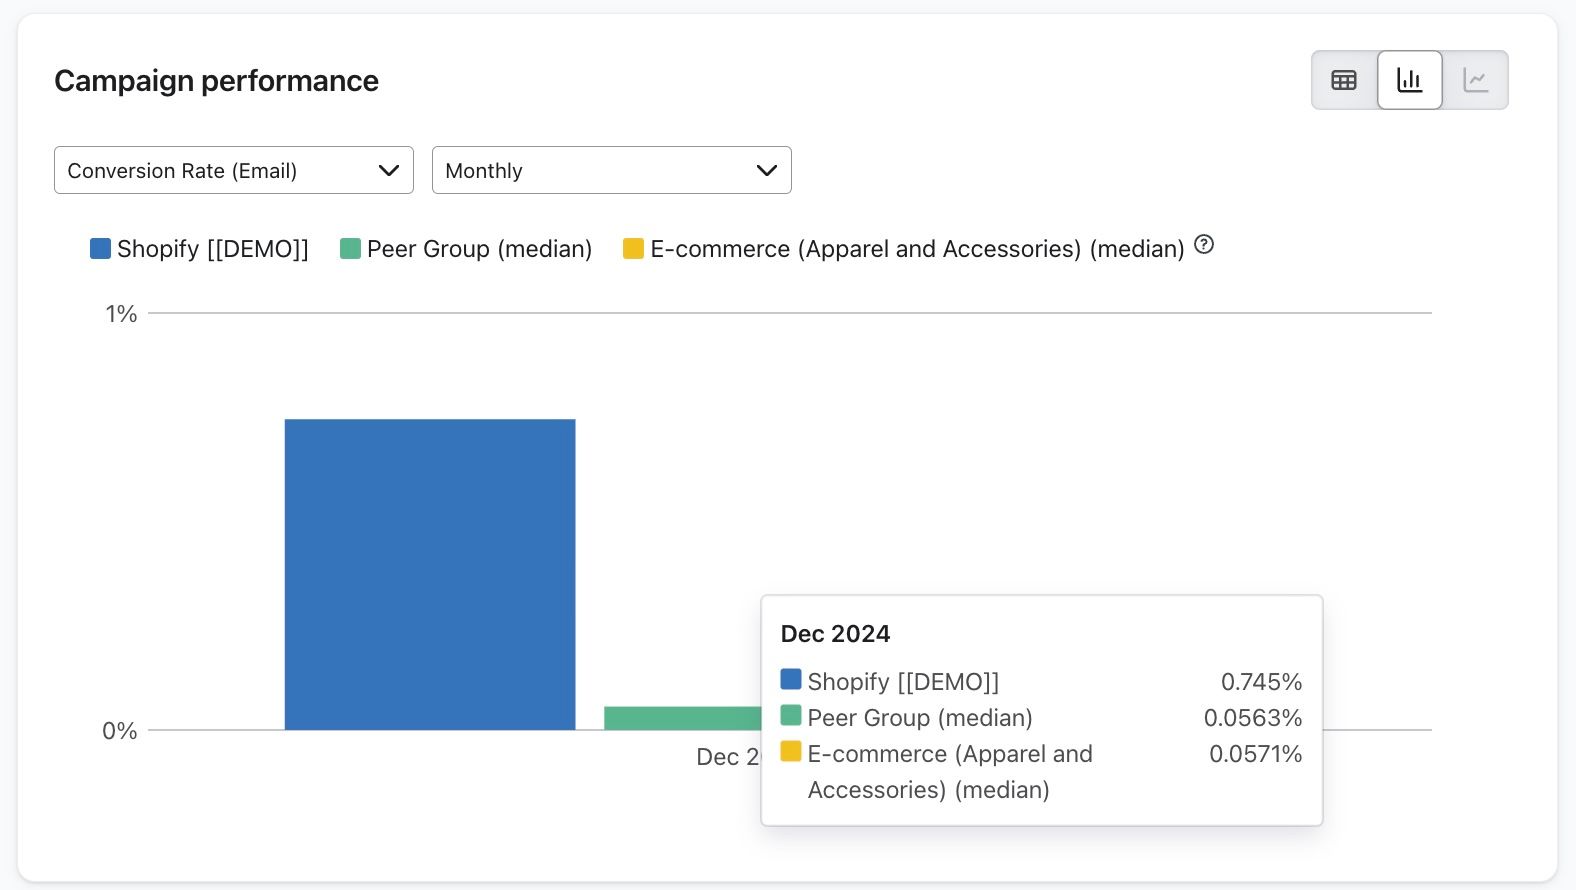
The Campaigns page shows provides a breakdown of key performance indicators related to your email and SMS campaigns. On this page, you can monitor your performance to ensure that you retain high deliverability and that your content resonates with your audience. The page contains a table, bar graph, and line graph outlining the areas where your campaigns excel and where they need to improve.
Displaying your data
By default, your Campaigns page will show a table view as shown in the example below.
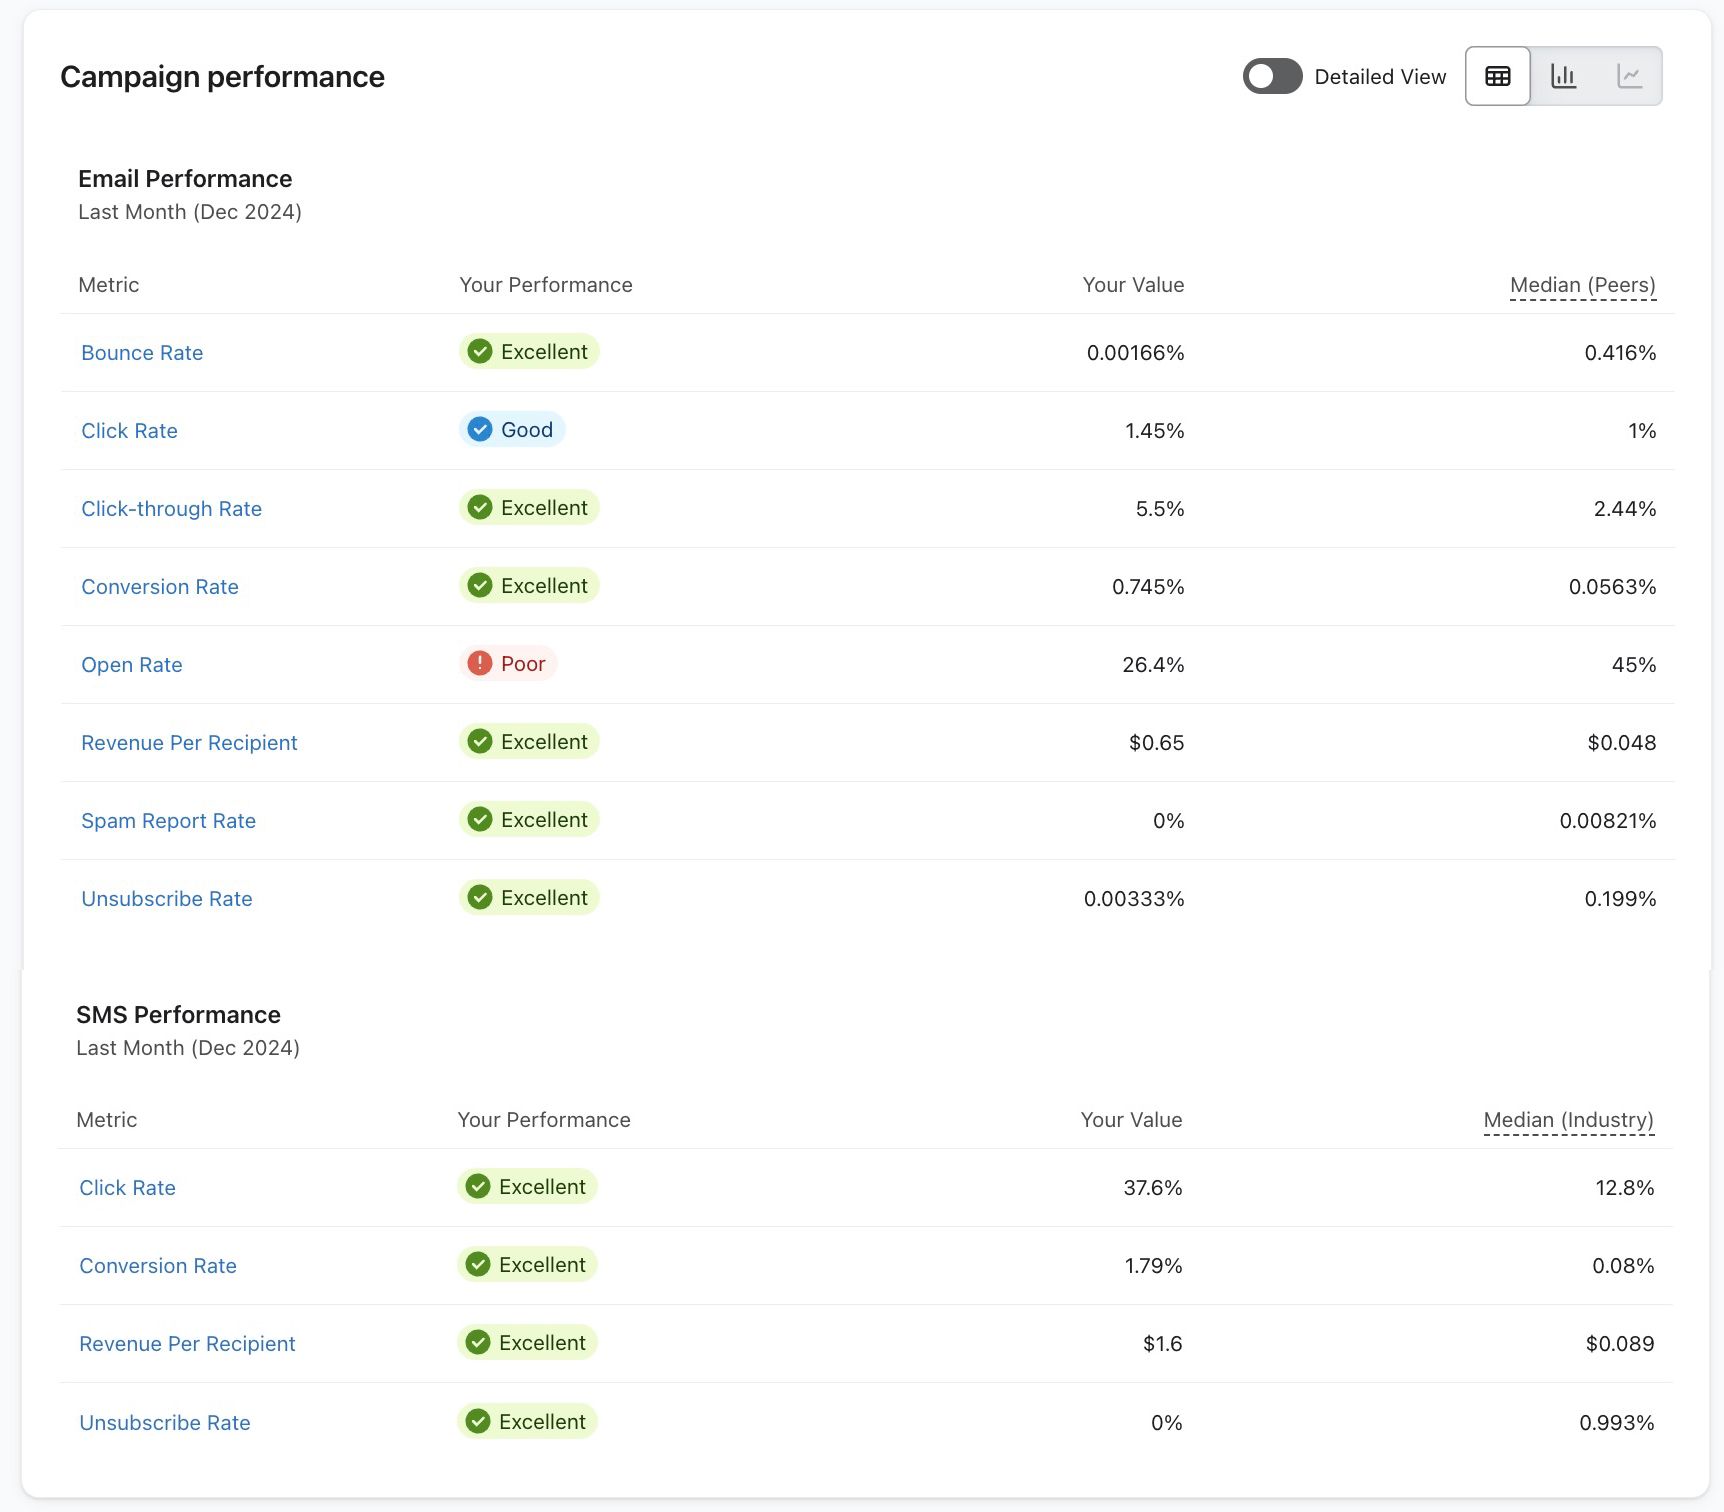
You can also choose to expose the data for percentiles by toggling the option for Detailed View on the upper right side.
Choosing your time period and metric
Before you narrow in on which flows you want to compare, we suggest first choosing the time period that you will pull data from and the metric you will use for understanding this data.
Note that you can always readjust this after you have chosen your flow or flow type if not enough data is displayed.
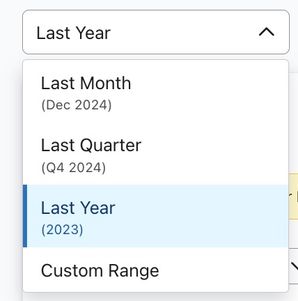
1. Choose your time period from the dropdown.
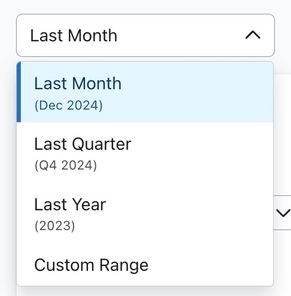
Here you will have options for showing flows data from a certain time period including to:
- Last month
- Last quarter
- Last year
- Custom range
2. In the bar or line chart views, navigate to the dropdown to the right of the metric dropdown to view the available performance metrics. You'll see metrics available for both email and SMS flows.
From here, you can choose the metric used to display your performance against peers (e.g., opens, clicks, placed order rates, etc.).
Performance indicators and values
The table outlines your email and SMS campaign performance metrics.
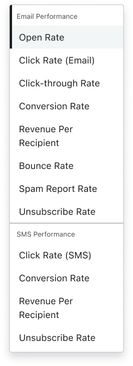
Email campaign performance:
- Open rate
Percentage of people who open your email out of those who receive it. - Click rate
Percentage of people who click a link in your email out of the people who receive your email. - Click through rate
Percentage of people who click a link in your email out of the people who open your email. - Conversion rate
Percentage of people who place an order after interacting with your email out of the people who receive your email. - Email revenue per recipient
Your total revenue attributed to email for a given timeframe divided by the total number of people who received an email within that time frame to give you a sense of how much revenue you're earning on average for each recipient. - Bounce rate
Percentage of times your email bounces. - Spam report rate
Percentage of people who report your email as spam out of those who receive your email. - Unsubscribe rate
Percentage of people who unsubscribe out of the people who receive your email.
SMS campaign performance:
- Click rate
Percentage of people who click a link in your SMS out of the people who receive your SMS. - Conversion rate
Percentage of people who place an order after interacting with your SMS out of the people who receive your SMS. - Revenue per Recipient
Your total revenue attributed to SMS for a given timeframe divided by the total number of people who received an SMS within that time frame to give you a sense of how much revenue you're earning on average for each recipient. - Unsubscribe rate
Percentage of people who unsubscribe out of the people who receive your SMS.
On the line chart and bar graph options, choose the appropriate performance indicator from the dropdown menu above the visualization.
Additional data display options
In the top-right corner of the table, you will see 3 options for viewing your data:
- Table
- Bar graph
- Line graph
You can toggle between the 3 options and view your data in the way that is most helpful to you. You will be shown the same data from the standard table view with all methods.
If you choose to display your data as a bar graph or a line chart, you will be shown the same data from the standard table view.
For the bar and line chart options, hover over the chart itself to see a breakdown of the data for your account, peer group, and industry. Additionally, you will see a status (Excellent, Good, Fair, or Poor) that rates your performance in comparison to Klaviyo best practices and your peer group.
Adjusting how data is displayed by time
By default, your data will display by month. To adjust how your data is displayed in the visual chart, you can choose another time display option.
1. Click on the dropdown next to the right of the metric dropdown.
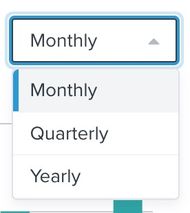
2. From here, choose to display the data monthly, quarterly, or yearly.
Your available selections for how data is displayed vary depending on the timeframe you chose to pull data from.
3. Once you choose your new time period display option, the chart will update below.
Using the flows page
The flows page showcases your performance over time and in relation to other companies similar to your own (i.e., peer groups). On this page, you can focus on all flows, specific flows, or certain types of flows such as a welcome series or abandoned cart flow. This allows you to track their success over time and identify areas with opportunity for improvement. You'll also see a breakdown of email flows and SMS flows.
Here, you will see:
- The time period data is pulled from
- Your chosen flow or groupings of flows
- Comparison to similar companies’ flows
- The metric (e.g., opens) used
- How data is displayed by time period (e.g., shown monthly)
- How data is displayed visually (e.g., table, bar, or line chart)
Choosing your time period and metric
Before you narrow in on which flows you want to compare, we suggest first choosing the time period that you will pull data from and the metric you will use for understanding this data.
Note that you can always readjust this after you have chosen your flow or flow type if not enough data is displayed.
1. Choose your time period from the dropdown.
Here you will have options for showing flows data from a certain time period including to:
- Last month
- Last quarter
- Last year
- Custom range
2. In the bar or line chart views, navigate to the dropdown to the right of the metric dropdown to view the available performance metrics. You'll see metrics available for both email and SMS flows.
From here, you can choose the metric used to display your performance against peers (e.g., opens, clicks, placed order rates, etc.).
Choosing your flow to compare
To understand how your flow or flow type compares to similar companies’ flows, you will need to select this from the first dropdown.
1. Select your desired flow or group of flows from the Your data dropdown.
You will have one of the following options to choose from:
- Grouped Flows: All Flows option
If your account has more than one flow altogether, this dropdown will include an option for All Flows. By choosing the All Flows option, you can compare all your account’s flows to aggregated peer data, regardless of flow type. This is helpful if you want to understand the general performance of your flows in comparison to that of the general performance of similar companies. - Grouped Flows: Welcome series, abandoned cart, browse abandonment, or thank you flows options
Additionally if you have multiple flows, the dropdown will also be divided into two sections: Grouped Flows and Individual Flows. Grouped Flows include the options for: welcome series flows, abandoned cart flows, browse abandonment flows, and thank you flows.
Your flows will be classified into one of these groupings by our automatic detection engine. If we cannot auto-detect your flow type, it will not be included in one of these groupings and instead be put into the All Flows grouping. - Individual Flows
This alphabetized list will include all flows that are live (noted by a green icon), manual (yellow icon), or in draft states (gray icon). Flows that are archived or deleted flows will not appear here.
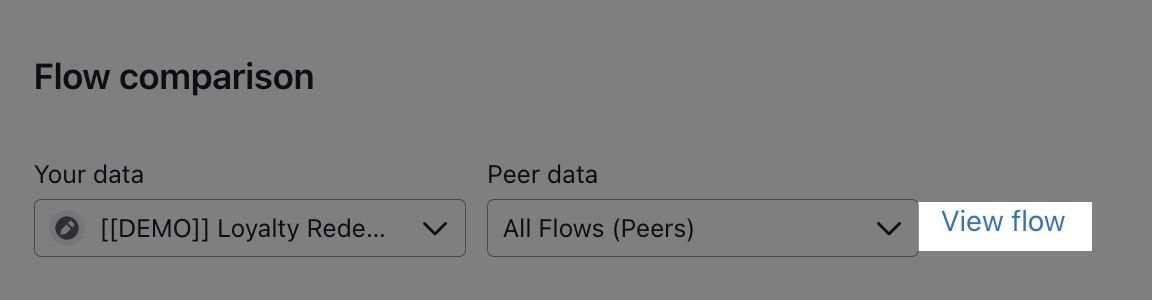
If you would like to review or refresh your memory on which flow you are choosing, click on the View Flow icon next to the peer data dropdown. This will take you to that flow’s overview page in your account.
Understanding your peer comparison flows
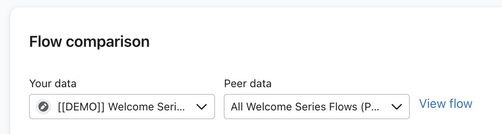
1. Once you have chosen your particular flow or type of flows, if possible, Klaviyo will automatically pull the comparative peer data.
For example, if you chose an individual flow that we think is an abandoned cart flow, you will see your flow compared to peer data of abandoned cart flows. And if you chose the abandoned cart grouping as your flow data, we will pull the comparative abandoned cart flow peer data.\
If Klaviyo cannot determine your flow type, we will compare your data to All Flows (peers) or general performance benchmarks from peers.
2. If you do not agree with the comparison flow data automatically chosen, you can click on the compared to: dropdown and choose another type. You can also choose to show aggregate, peer flow performance, regardless of type, by selecting the All Flows (peers). Once you choose your new peer data option, the chart will update below.
Displaying your data
Once you have chosen your flow and comparative peer data, you will be shown a visualization of this data in a table, bar, or line chart.
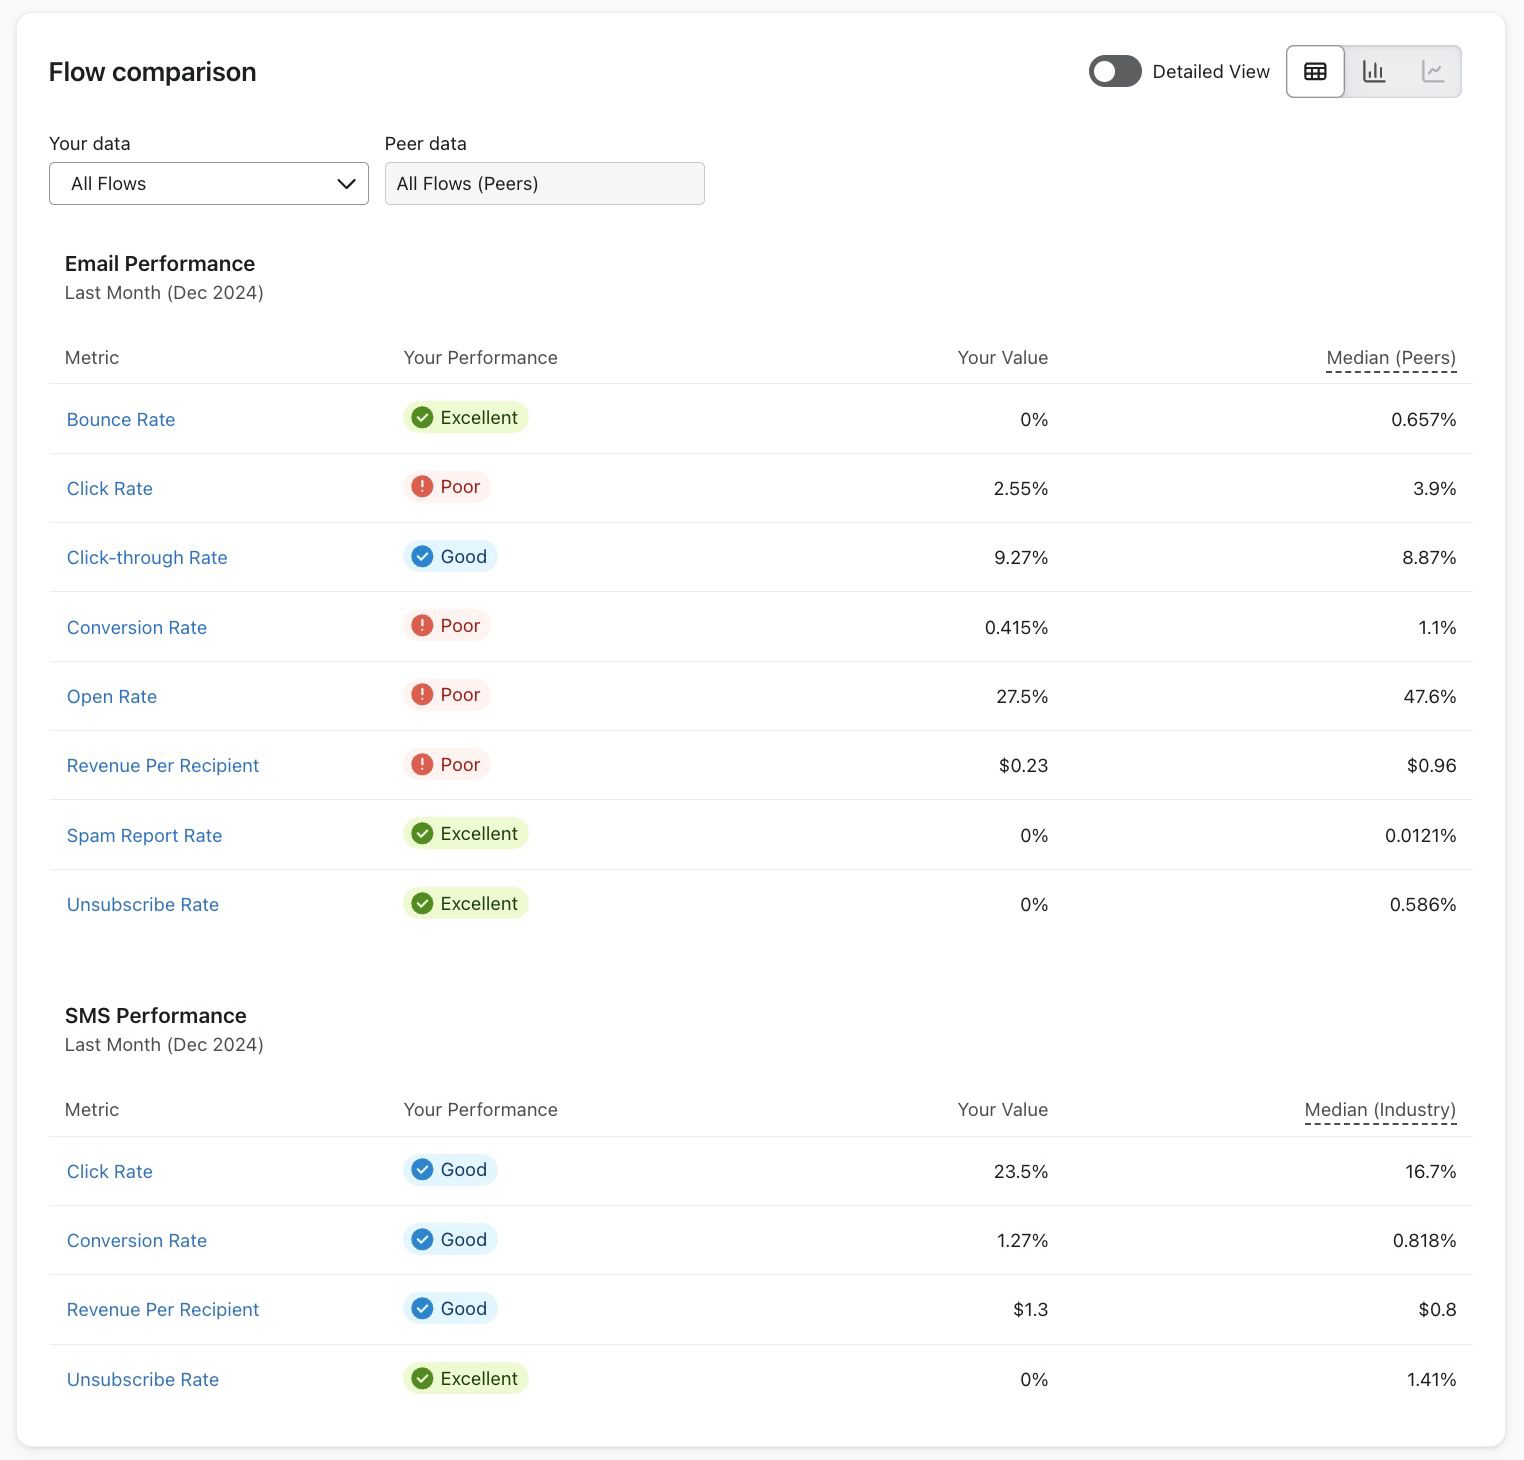
By default, you will be shown a table view, with the following columns and values:
- Metric
The metrics we display represent the performance of your account. Examples include open rate, click rate, and placed order rate. - Your performance
Connotes how well each performance indicator has functioned in relation to your peer group. These statuses are Poor, Fair, Good, and Excellent. For more information on what statuses entail and how to improve your performance, head to How to improve your benchmark results. - Your value
The raw amount equated to the given performance indicator; e.g., for average order value, you will see the exact monetary value for your business. - Median (peers)
The value attributed to companies in the middle tier of performance. Half of the companies perform better than the median, and half perform worse.
For example, the table below shows overall performance over the last three months across all flows.
You can also choose to expose the data for percentiles by toggling the option for Detailed View.
Additional display options
In the top-right corner of the table, you will see 3 options for viewing your data:
- Table
- Bar graph
- Line graph
You can toggle between the 3 options and view your data in the way that is most helpful to you. You will be shown the same data from the standard table view with all methods.
If you choose to display your data as a bar graph or a line chart, you will be shown the same data from the standard table view.
For the bar and line chart options, hover over the chart itself to see a breakdown of the data for your account, peer group, and industry. Additionally, you will see a status (Excellent, Good, Fair, or Poor) that rates your performance in comparison to Klaviyo best practices and your peer group.
Performance indicators and values
The performance indicators available to view in your flow performance table and graphs include different metrics for email and SMS flows.
The following email flow performance indicators are available:
- Open rate
Percentage of people who open your email out of those who receive it - Click rate
Percentage of people who click a link in your email out of the people who receive your email - Click through rate
Percentage of people who click a link in your email out of the people who open your email - Conversion rate
Percentage of people who place an order after interacting with your email out of the people who receive your email - Email revenue per recipient
Your total revenue attributed to email for a given timeframe divided by the total number of people who received an email within that time frame to give you a sense of how much revenue you're earning on average for each recipient - Spam report rate
Percentage of people who report your email as spam out of those who receive your email - Unsubscribe rate
Percentage of people who unsubscribe out of the people who receive your email - Bounce rate
Percentage of times your email bounces
The following SMS flow performance indicators are available:
- Click rate
Percentage of people who click a link in your SMS out of the people who receive your SMS - Conversion rate
Percentage of people who place an order after interacting with your SMS out of the people who receive your SMS - Revenue per recipient
Your total revenue attributed to SMS for a given timeframe divided by the total number of people who received an SMS within that time frame to give you a sense of how much revenue you're earning on average for each recipient - Unsubscribe rate
Percentage of people who unsubscribe out of the people who receive your SMS
Adjusting how data is displayed by time
By default, your data will display by month. To adjust how your data is displayed in the visual chart, you can choose another time display option.
1. Click on the dropdown next to the right of the metric dropdown.
2. From here, choose to display the data monthly, quarterly, or yearly.
Your available selections for how data is displayed vary depending on the timeframe you chose to pull data from.
3. Once you choose your new time period display option, the chart will update below.
Using the signup forms page
The Sign-up forms page provides a view of your popups’ success through the submit rates and comparing your results to peer benchmarks. These peer benchmarks can help you recognize where you may be falling short with each of your forms.
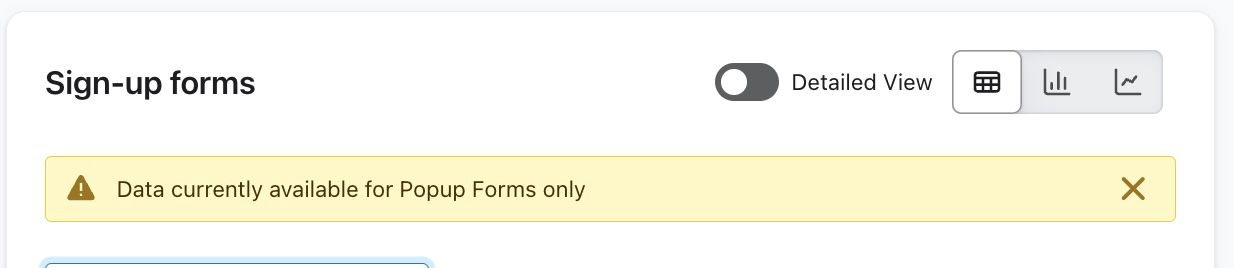
Benchmarks data is currently only available for popup forms. Flyout and embedded forms are not supported on this performance page.
Displaying your data
By default, your signup forms page will show a table view, as in the example below. Since form performance is only tied to submit rate, that will be the only conversion metric used. Your submit rate is the total number of form submissions divided by the total number of form views, in a particular time period.
You will see a raw percentage of submit rates and your performance against the peer group median.
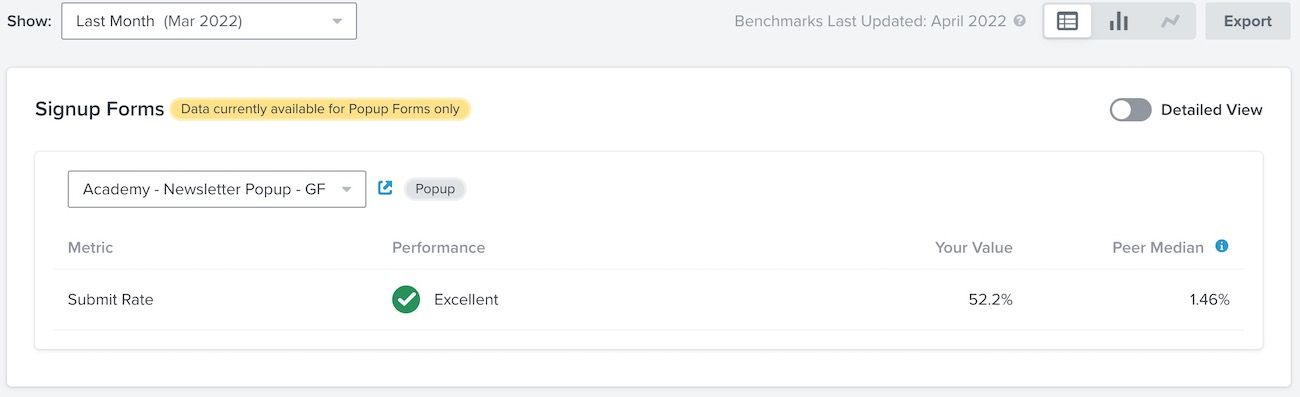
Additionally, we will then ascribe one of the following performance statuses to your rate:
- Poor
The submit rate is less than the 25th percentile for the peer group. - Fair
The submit rate is between the 25th and 50th percentiles for the peer group. - Good
The submit rate is between the 50th and 75th percentiles for the peer group. - Excellent
The submit rate is greater than the 75th percentile for the peer group.
You can find the submit rates for a particular form by choosing it from the dropdown menu.
Note that this list only includes popup forms and is organized alphabetically. Forms that are still in draft mode will display with the gray icon and live forms with the green icon. If a draft form has never been published, it will not display any data.
You can also adjust the date range to pull in data for a given time period.
Detailed view
To expose additional data for benchmarks percentiles, toggle the option for Detailed View in the upper right side.
The Detailed View table will show your overall submit rate percentile, and where you land in the 25th, median, and 75th percentiles. The 25th percentile is the value attributed to companies in the lowest tier, the median is the value attributed to companies in the middle tier, and the 75th percentile is the value attributed to companies in the highest tier of performance. In other words, if your percentile is in the 70th, this means that you performed better than 70% of similar peers.
Additional display options
In the top-right corner of the table, you will see 3 options for viewing your data:
- Table
- Bar graph
- Line graph
You can toggle between the 3 options and view your data in the way that is most helpful to you. You will be shown the same data from the standard table view with all methods.
If you choose to display your data as a bar graph or a line chart, you will be shown the same data from the standard table view.
Note that the line chart will only appear for time periods longer than one month.
For the bar and line chart options, hover over the chart itself to see a breakdown of the data for your account, peer group, and industry. Additionally, you will see a status (Excellent, Good, Fair, or Poor) that rates your performance against your peer group.
Learning from benchmarks results
It is important to learn from your benchmarking data and make necessary adjustments to grow your business. For performance indicators that rank as poor or fair, dig deeper into why that is the case. Then, build a strategy that you can implement to amend those shortcomings and expand upon areas that are best serving your brand.
Learn how to analyze and improve your benchmark performance.
Additional resources
- Getting started with reporting
Learn about the different robust Klaviyo reporting tools available in your account. Klaviyo is built to help your business grow and strengthen your relationships with your audience by putting data to work. Segmentation and automation tools allow you to personalize and target your communication efforts across channels to boost engagement and drive business growth. However, in order to understand how well your business strategies and marketing efforts are working, you need proper reporting to measure and analyze performance trends over time.
- Getting started with custom reports in Klaviyo
Learn how to use Klaviyo custom reports to monitor your business' health across each of your marketing channels and individual products or services. By using these reports, you can leverage your data to uncover trends in customer behavior, align your team around a cohesive marketing strategy, and grow your business as you act upon new insights.Just starting out with Klaviyo reporting? Learn more about feature-specific reports and get a general overview of Klaviyo’s analytics tools.
- Customizing your analytics experience