How to export flow analytics
You will learn
Learn how to export a CSV file of analytics for all or a specific set of flows. Exporting the analytics for a certain flow allows you to easily measure and review how successful a flow is. Further, you can analyze the data on a message by message basis, examining how each SMS or email is performing. In this article, we run through how to export a flow's analytics.
Owners, Admins, and Analysts are able to export flow analytics.
Export all flow analytics
To export the analytics for all flows:
- Navigate to the Flows tab.
- Click the Options dropdown at the top.
- Click Export analytics.
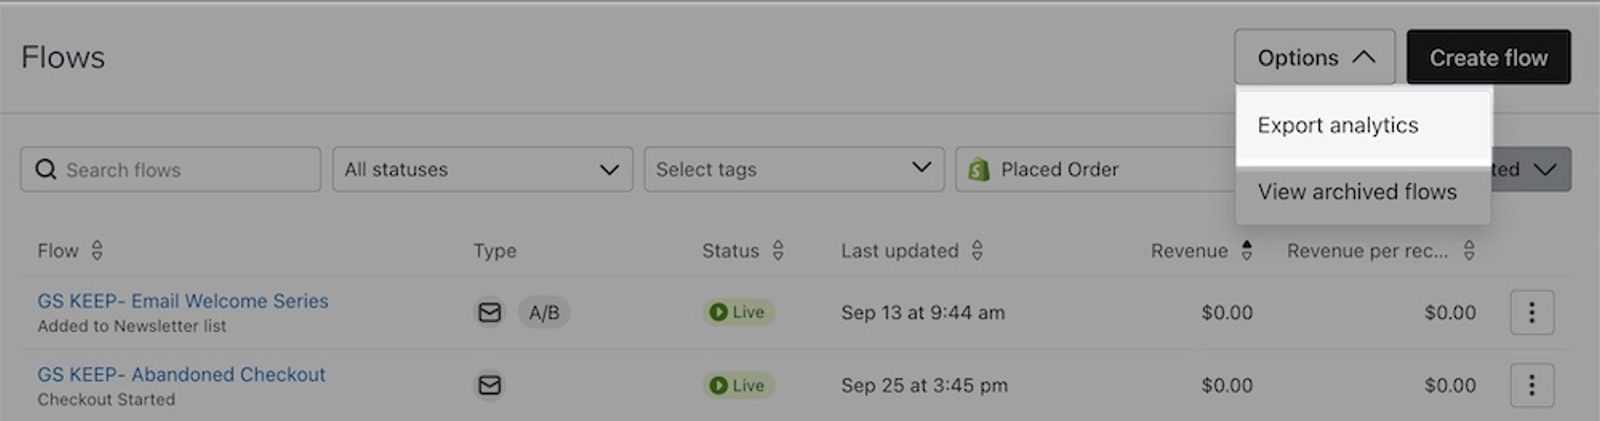
- When you click this option, a modal will appear with options for setting up your export. Choose from the following options:
- Select time range
Choose All-time, a preset time range, or Custom to select start and end dates for the analytics. - Select tags
If you are using tags to organize your flows, you can specify to only export flows that have a certain tag. - Aggregate analytics by day, week, or month
Select this checkbox, then choose Daily, Weekly, or Monthly to show analytics for each interval in separate rows. Leave it unchecked for a total for the selected time range. - Include all A/B test message variations
If you're A/B testing any of your flow emails, this option allows you to view the analytics of each variation separately.
- Select time range
Note if you want to export the analytics for a single flow, create a new tag, and then tag the flow and export the analytics for that tag.
- Once you are done setting up your export, click Export. Wait for the export to finish; the CSV will download when it is ready.
Information in the exported file
Note that your data will include archived flows that fall within your export’s time range. Additionally, your chosen time range will pull data based on your account’s local timezone.
The resulting CSV contains the following columns. If you aggregate analytics, a Day, Week starting on, or Month column appears first. The conversion column names depend on your selected conversion metric, and value columns appear only if that metric has a value.
- Flow ID
- Flow Name
- Flow Message ID
- Flow Message Name
- Flow Message Channel
- Status
- Delivered
- Unique Opens
- Open Rate
- Unique Clicks
- Click Rate
- Selected conversion metric (e.g., Placed Order)
- Selected conversion metric rate (e.g., Placed Order Rate)
- Conversion value (e.g., Revenue; if available)
- Conversion value per recipient (e.g., Revenue per Recipient; if available)
- Unsub Rate
- Complaint Rate
- Bounce Rate
- Tags
If you select Include all A/B test message variations, the following columns appear between Flow Message Channel and Status. Messages without an associated A/B test show "n/a" in these columns.
- A/B Test Name
- Variant Name
- A/B Test Dates
- Winning Variant
For exports that include A/B test variations, you may see multiple rows for the same message ID. Each row contains data for a different variation. The example below shows the data for a flow which had 2 separate A/B tests run for its first message. The first 2 rows are from the 2 variations of the first A/B test. The second 2 rows are the variations for its second test.

If a message was live and sending before an A/B test was created for it, you will see an additional row for the main message along with the rows for each variation.
Additional resources
Learn more about analytics and reporting:
- Understanding flow analytics
Learn how to review the performance of your Klaviyo flow messages, including open, click, and conversion rates.
- Understanding available campaign analytics
Learn how to use Klaviyo's campaign reporting to gather insights on how your messages are performing and what happens after someone opens or clicks. Use these campaign analytics to dig deeper into website activity, checkouts started, and revenue that is directly attributabed to each message.
- Getting started with a custom reporting strategy
Learn how to build a comprehensive reporting strategy to grow your business and answer any key performance questions that arise over time. Klaviyo’s robust, customizable analytics let you leverage your data to understand business and marketing performance. With our custom report builder you can understand how customers interact with your messaging over time, identify what owned marketing efforts need to be improved upon, and focus on where you should adjust your marketing strategy to grow your business.