Setting up key hotel reports with Mews
Overview
This guide explains how to create 3 dashboards in Klaviyo using Mews' Confirmed Room Night and Completed Room Night event metrics. These metrics give you granular, per-night visibility into booking performance and stay revenue — broken out by property, source, and resource type.
Dashboard | Metric Used | What It Shows | Use Case |
|---|---|---|---|
Historical Daily Room Revenue from Stays | Completed Room Night | Total room revenue per night | View the revenue attributable to each night |
ADR from Stays | Completed Room Night | Average nightly rate for stays | View the average daily rate historically |
ADR from New Bookings | Confirmed Room Night | Average nightly rate at time of booking | View the average daily rate for new bookings to monitor changes in booking value |
Prerequisites
- Your Mews integration must be connected to Klaviyo. See Getting started with Mews for setup instructions.
- You need permission to create and edit dashboards. The Owner, Admin, Manager, and Analyst roles have this access.
- Confirm that Confirmed Room Night and Completed Room Night appear under Analytics > Metrics before building these dashboards.
These dashboards report on room-night events synced to Klaviyo. Room nights for guests using an online travel agency (OTA) masked email address are excluded, so totals can differ from Mews.
Dashboard 1: Historical Daily Room Revenue from Stays
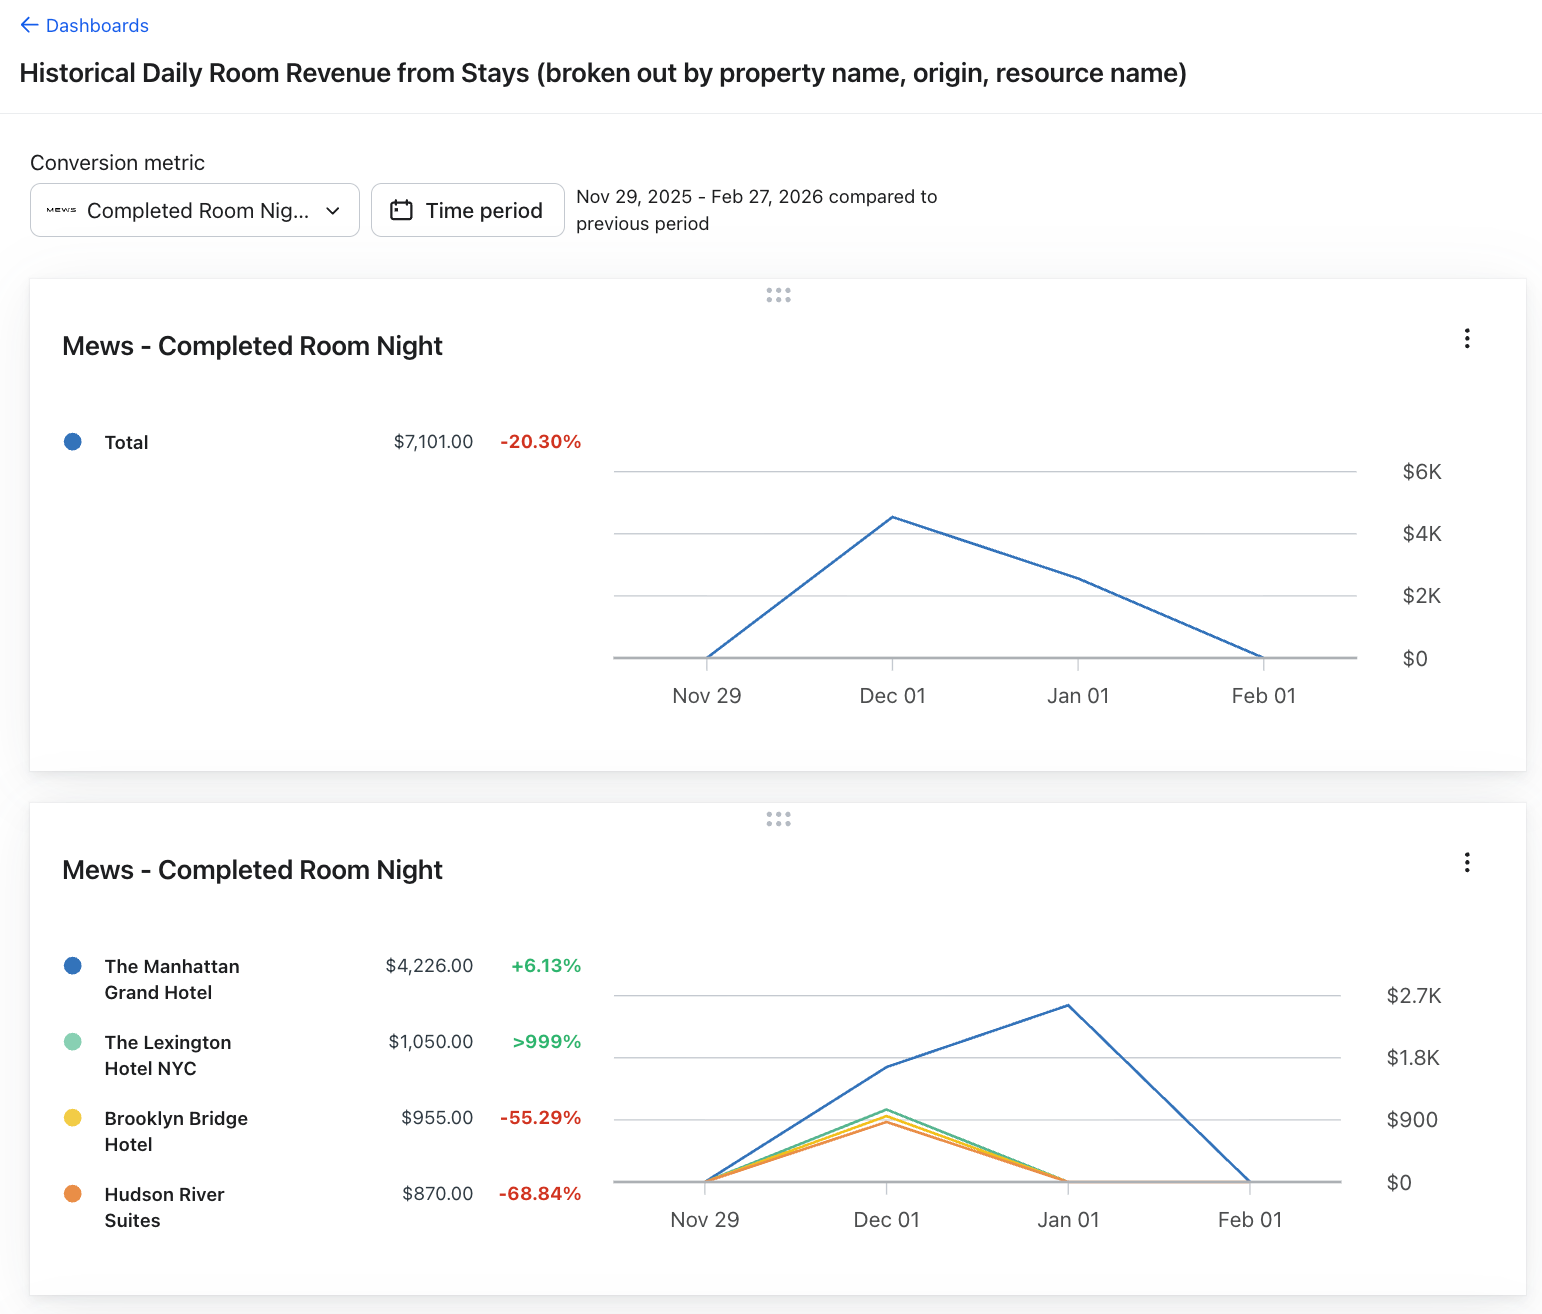
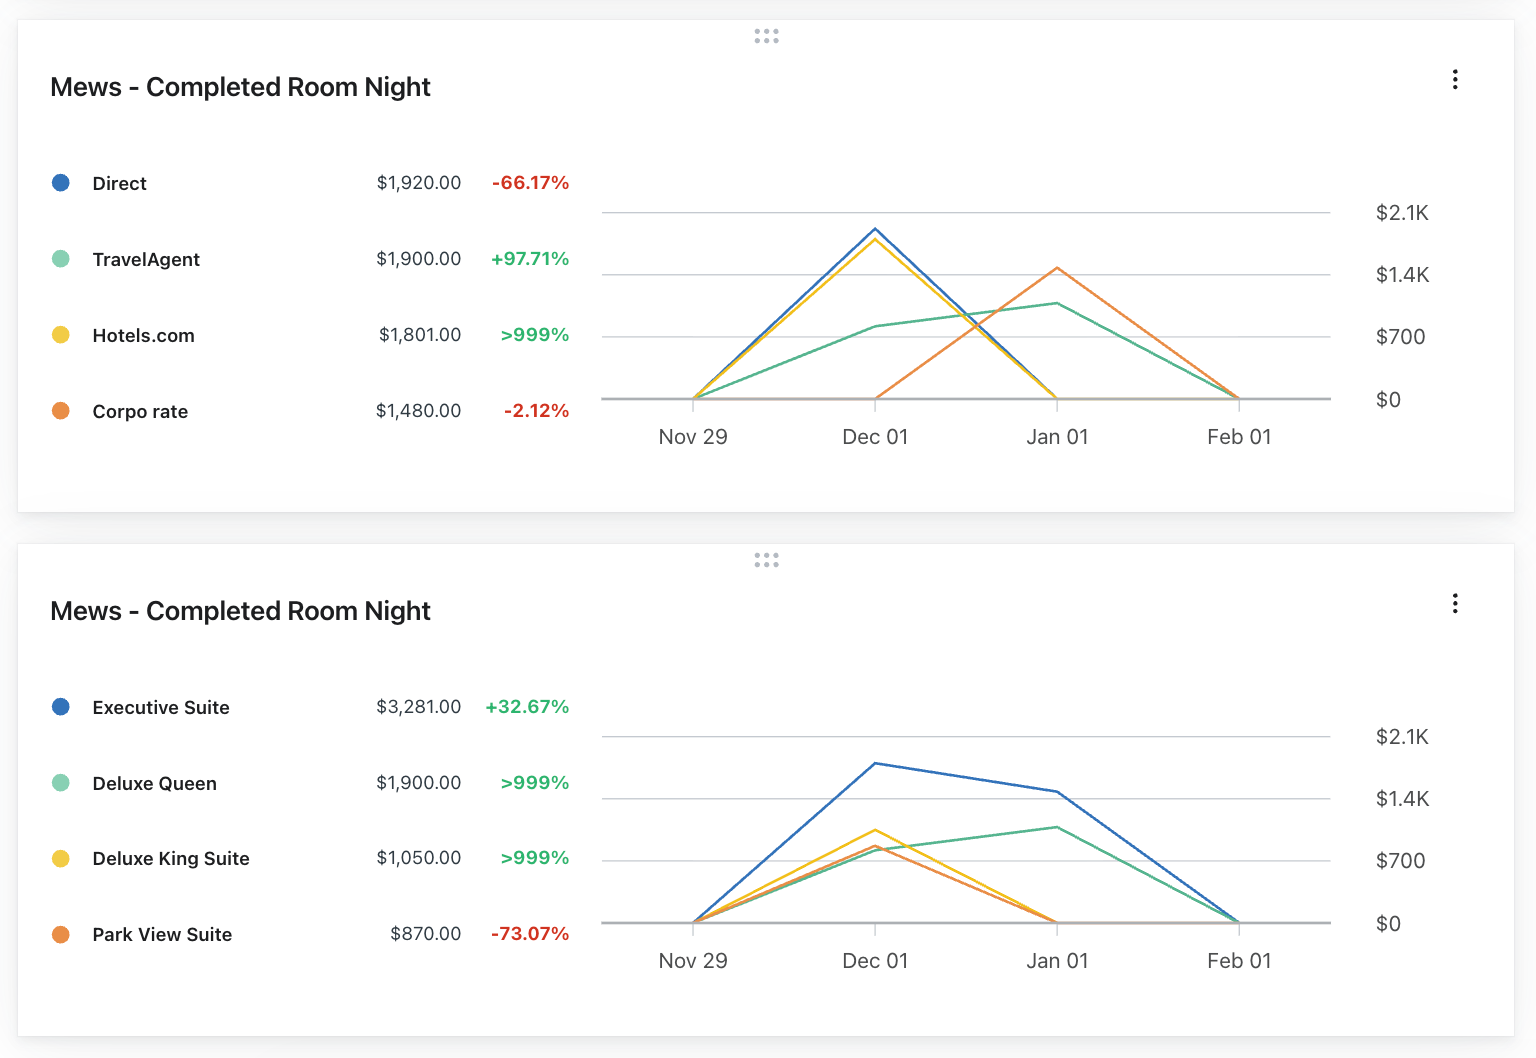
This dashboard measures the historical daily room revenue — useful for evaluating the revenue attributable to each night. At the end of these steps, your dashboard for daily room revenue will look like this:
Steps
1. Log in to Klaviyo
2. In the left-hand navigation, click Analytics, then click Dashboards.
3. Click Create Dashboard. Name it as you like (e.g. Historical Daily Room Revenue from Stays).
4. Click Create Dashboard.
Add Card 1 — Historical Revenue from Stays
- Click Add card > Create from scratch. Configure the card with the settings below:
- Metric: Completed Room Night
- Measurement: Value (total room-night revenue)
- Group by: (none)
- Visualization: Line graph
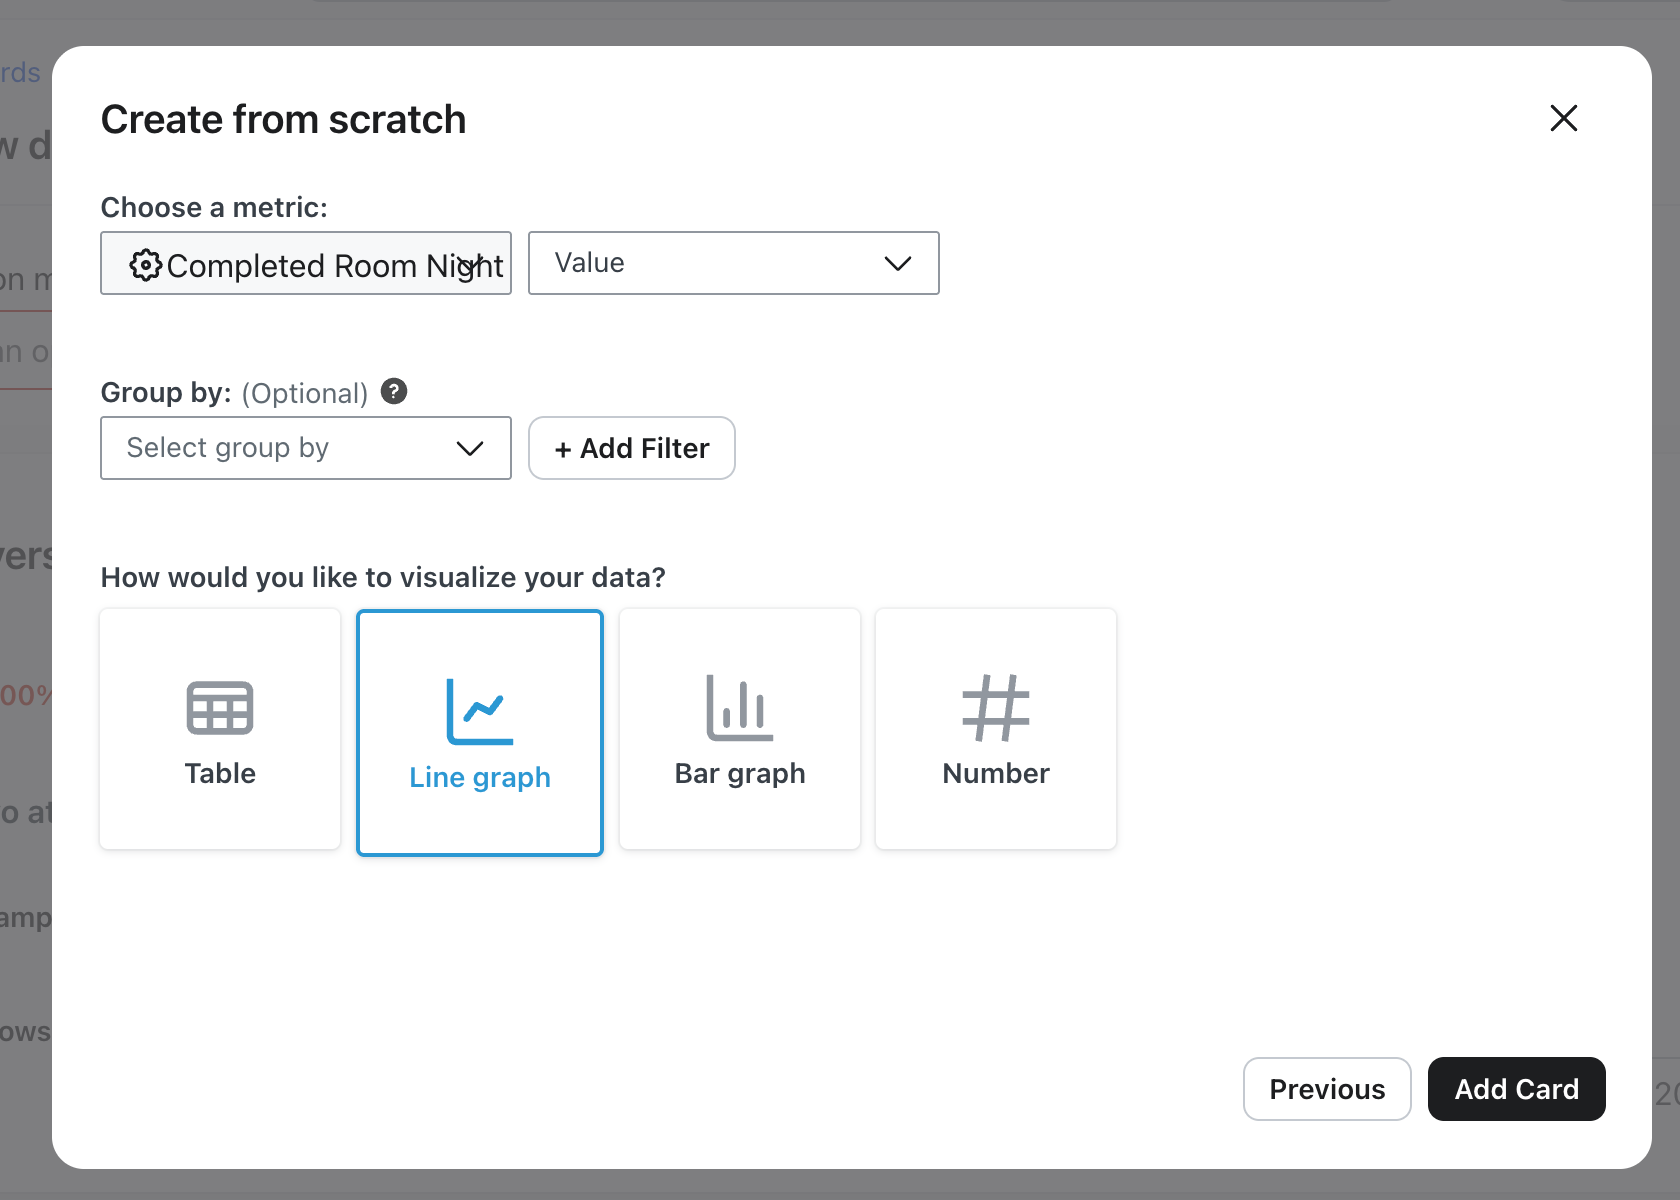
2. Click Add Card.
Add Card 2 — Historical Revenue from Stays by Resource Type
Same process as above, except select Group by ResourceName.
- Metric: Completed Room Night
- Measurement: Value (total room-night revenue)
- Group by: ResourceName
Grouped line graphs show up to 5 values, such as properties, room types, or booking origins. Choose Table instead of Line graph if you need to see all values in a grouping.
Add Card 3 — Historical Revenue from Stays by Property Name
Same process as above, except select Group by PropertyName.
- Metric: Completed Room Night
- Measurement: Value (total room-night revenue)
- Group by: PropertyName
Add Card 4 — Historical Revenue from Stays by Origin
Same process as above, except select Group by Origin.
- Metric: Completed Room Night
- Measurement: Value (total room-night revenue)
- Group by: Origin
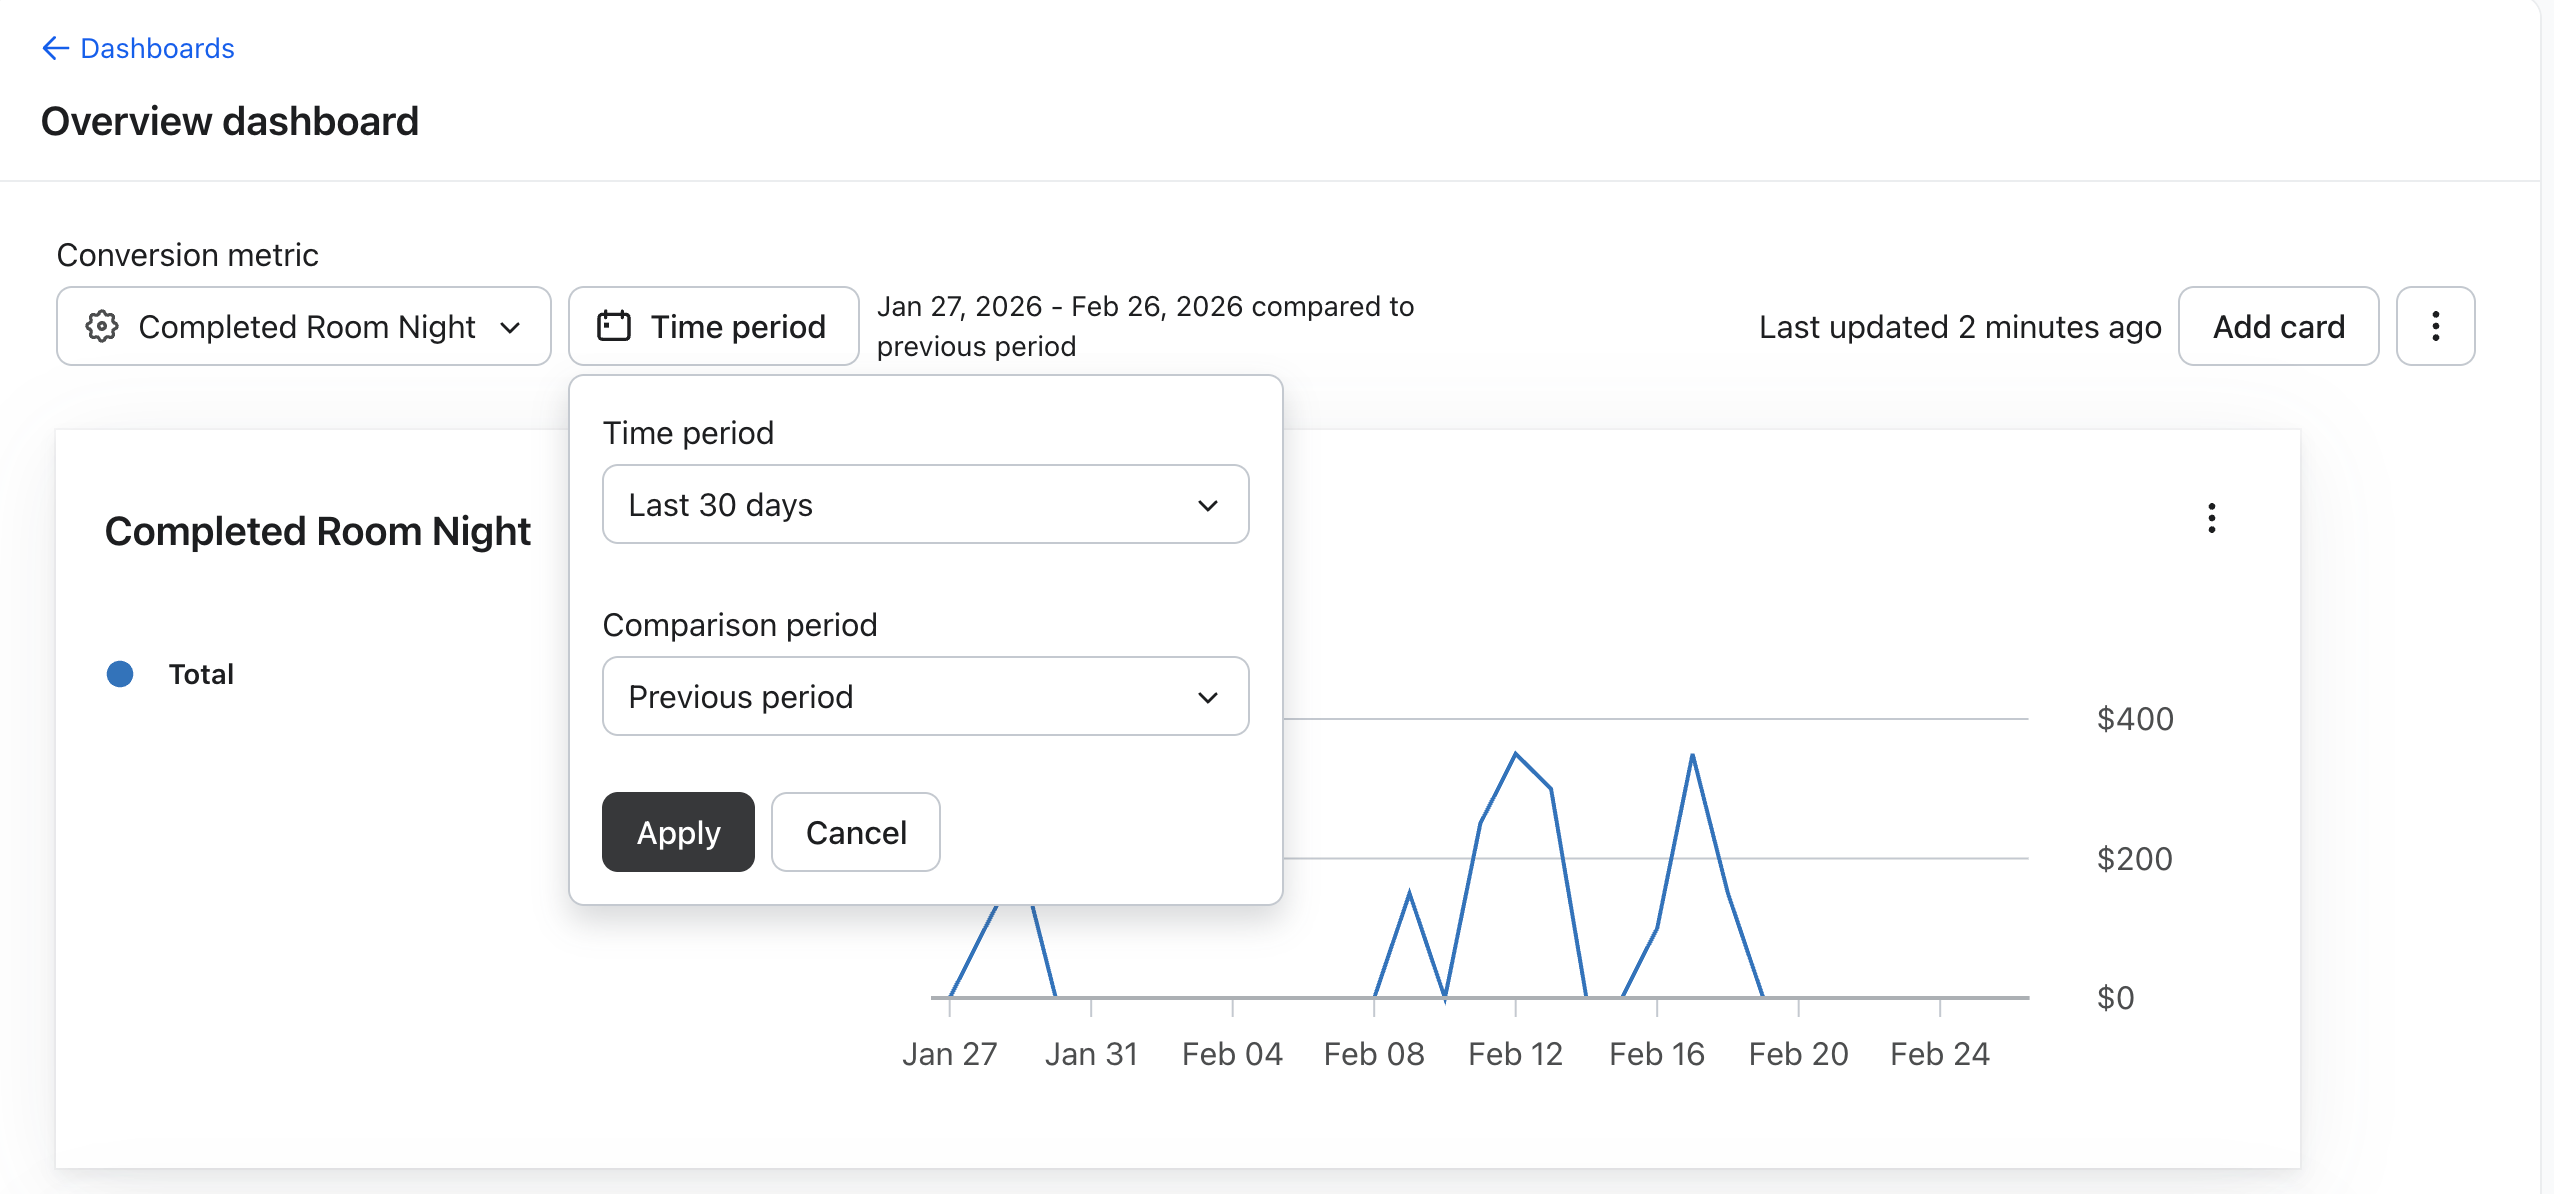
Click Time period, choose Last 30 days for daily data, and click Apply. For longer ranges, the graph can switch to weekly or monthly points. Each custom card uses the metric selected in its own settings; you do not need to change Conversion metric for these cards.
Dashboard 2: ADR from Stays
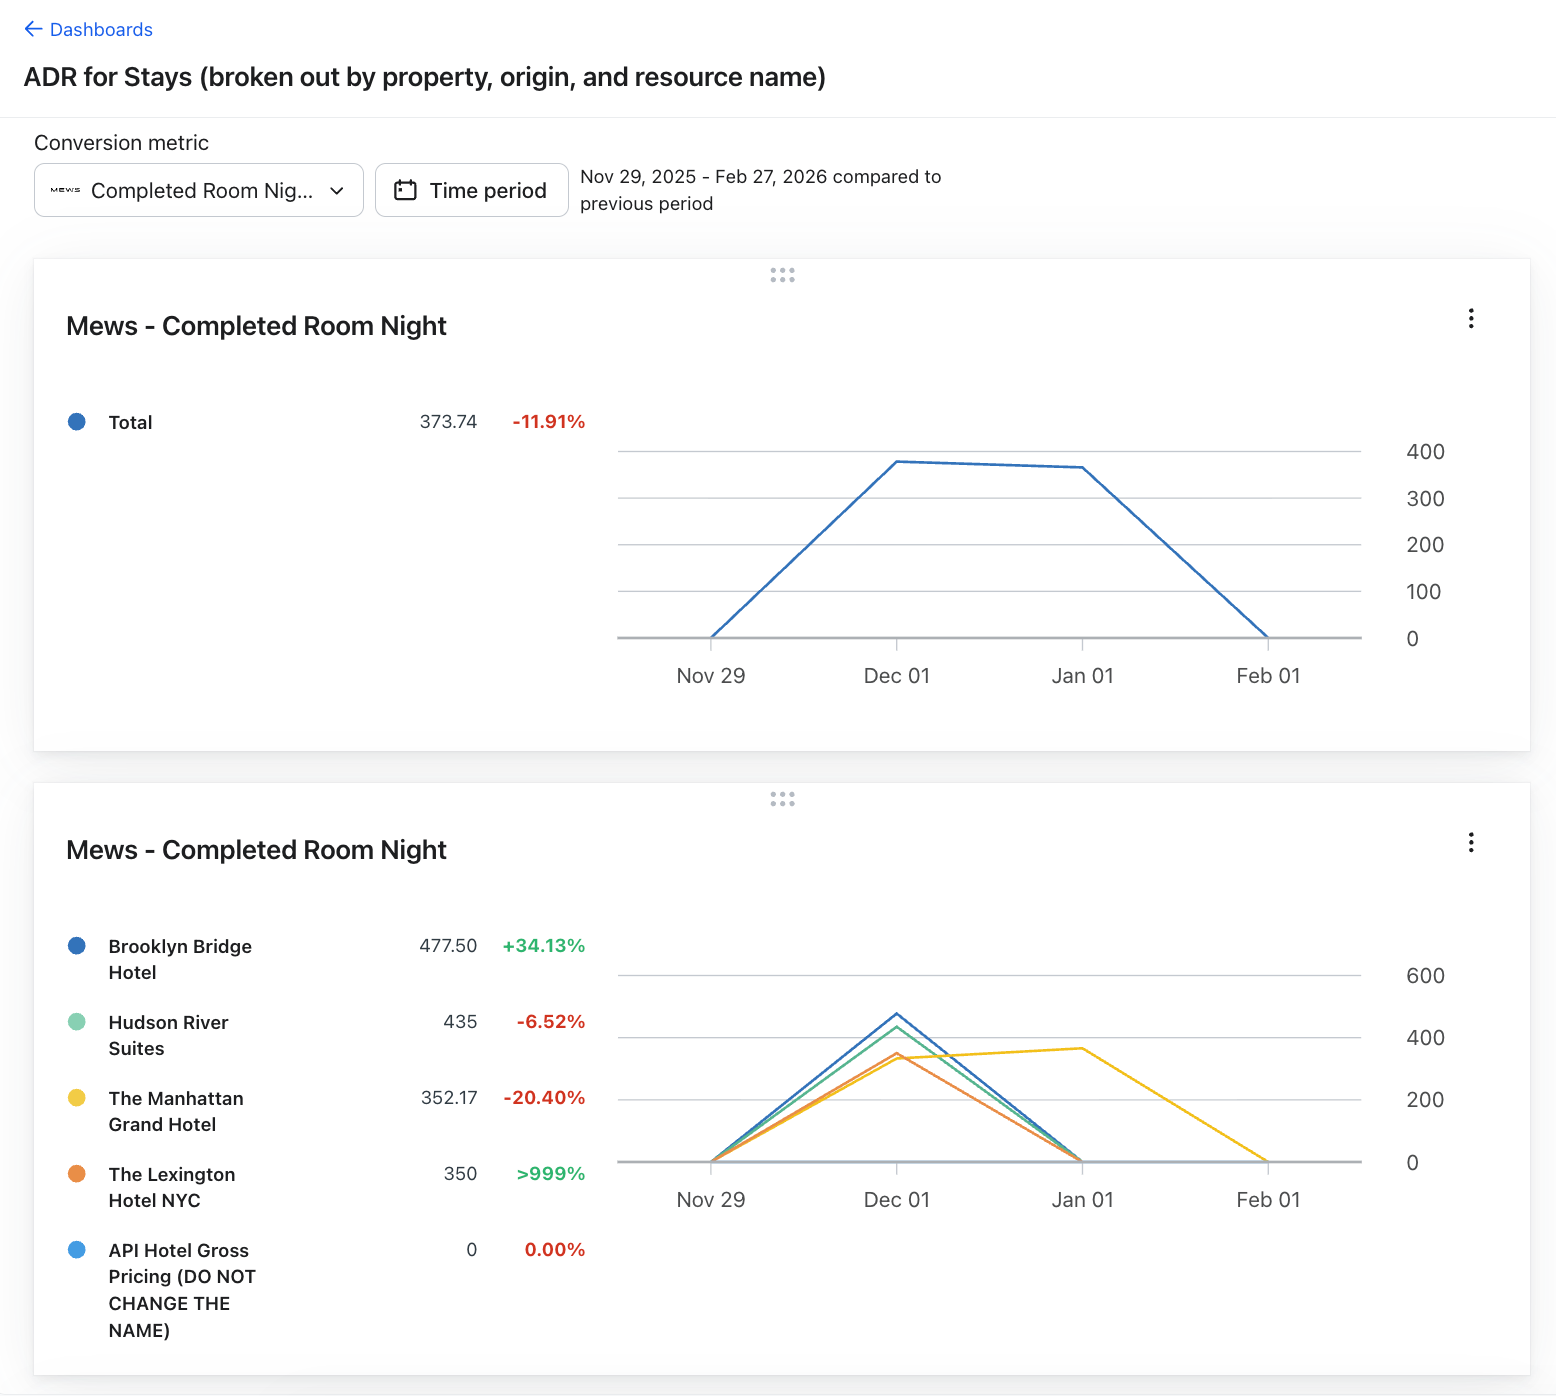
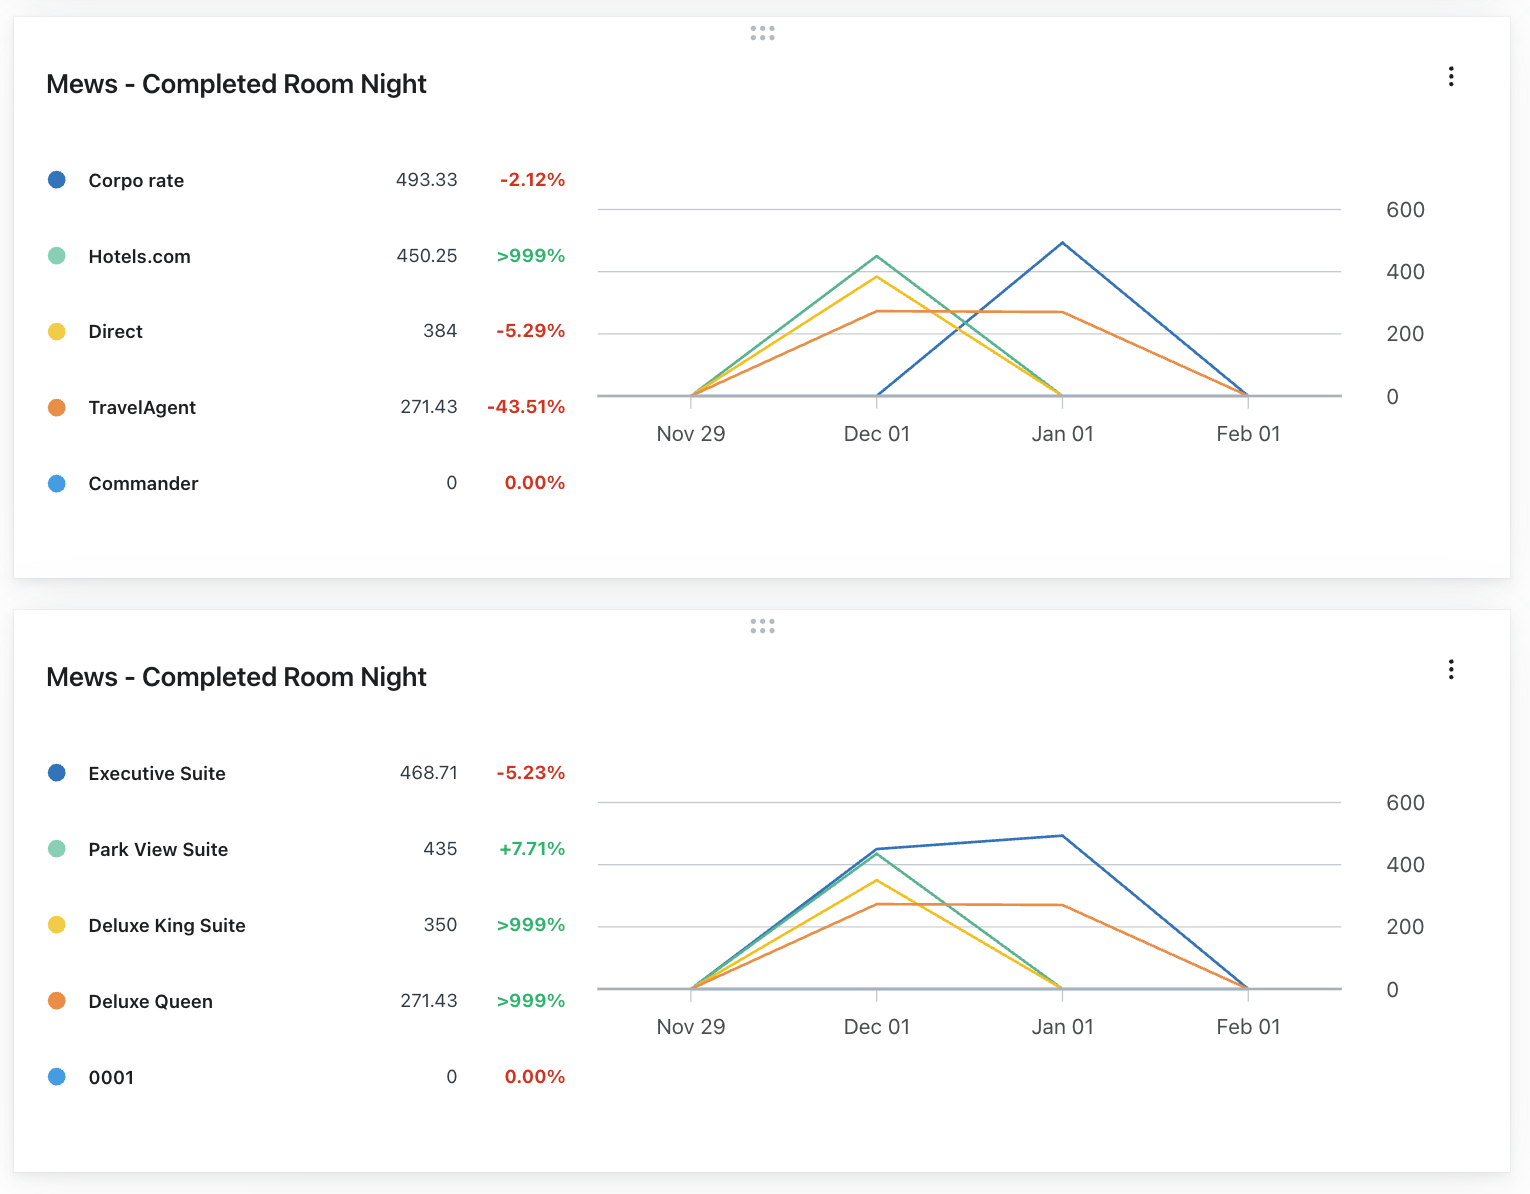
This dashboard shows the Average Daily Rate (ADR) for nights actually stayed — answering "how much are guests paying per room, per night?" At the end of these steps, your dashboard for average daily rate will look like this:
Steps
- Navigate to Analytics > Dashboards and click Create Dashboard.
- Enter a name, such as ADR from Stays, and click Create Dashboard.
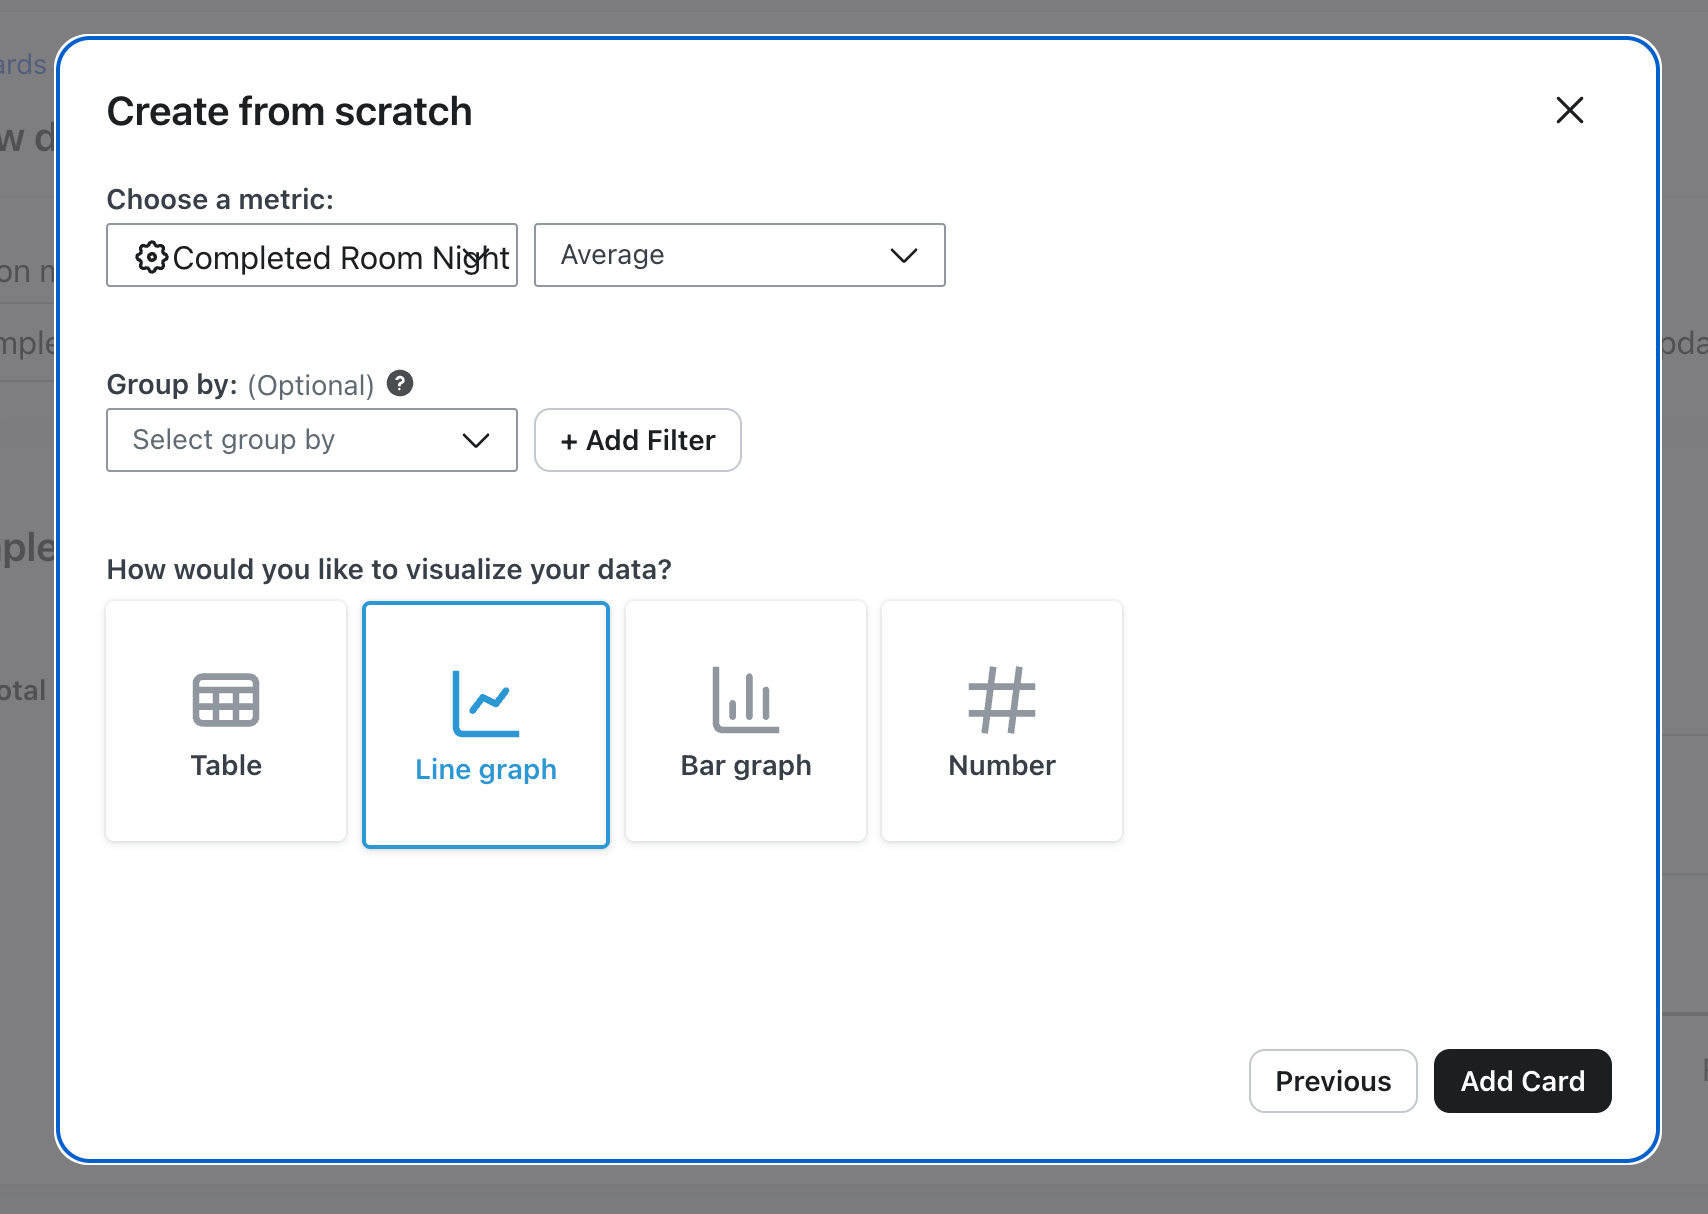
- Click Add card > Create from scratch.
- Select the metric, measurement, and grouping listed for the card below. Leave Group by blank for Card 1, and choose Line graph.
- Click Add Card. Repeat steps 3–5 for the remaining 3 cards below.
Add Card 1 — ADR from Stays
- Metric: Completed Room Night
- Measurement: Average (average room-night revenue)
- Group by: (none)
Add Card 2 — ADR from Stays by Property Name
- Metric: Completed Room Night
- Measurement: Average (average room-night revenue)
- Group by: PropertyName
Add Card 3 — ADR from Stays by Origin
- Metric: Completed Room Night
- Measurement: Average (average room-night revenue)
- Group by: Origin
Add Card 4 — ADR from Stays by Resource Type
- Metric: Completed Room Night
- Measurement: Average (average room-night revenue)
- Group by: ResourceName
Click Time period, choose your date range and comparison period, and click Apply. Use Last 30 days to see daily data.
Dashboard 3: ADR from New Bookings
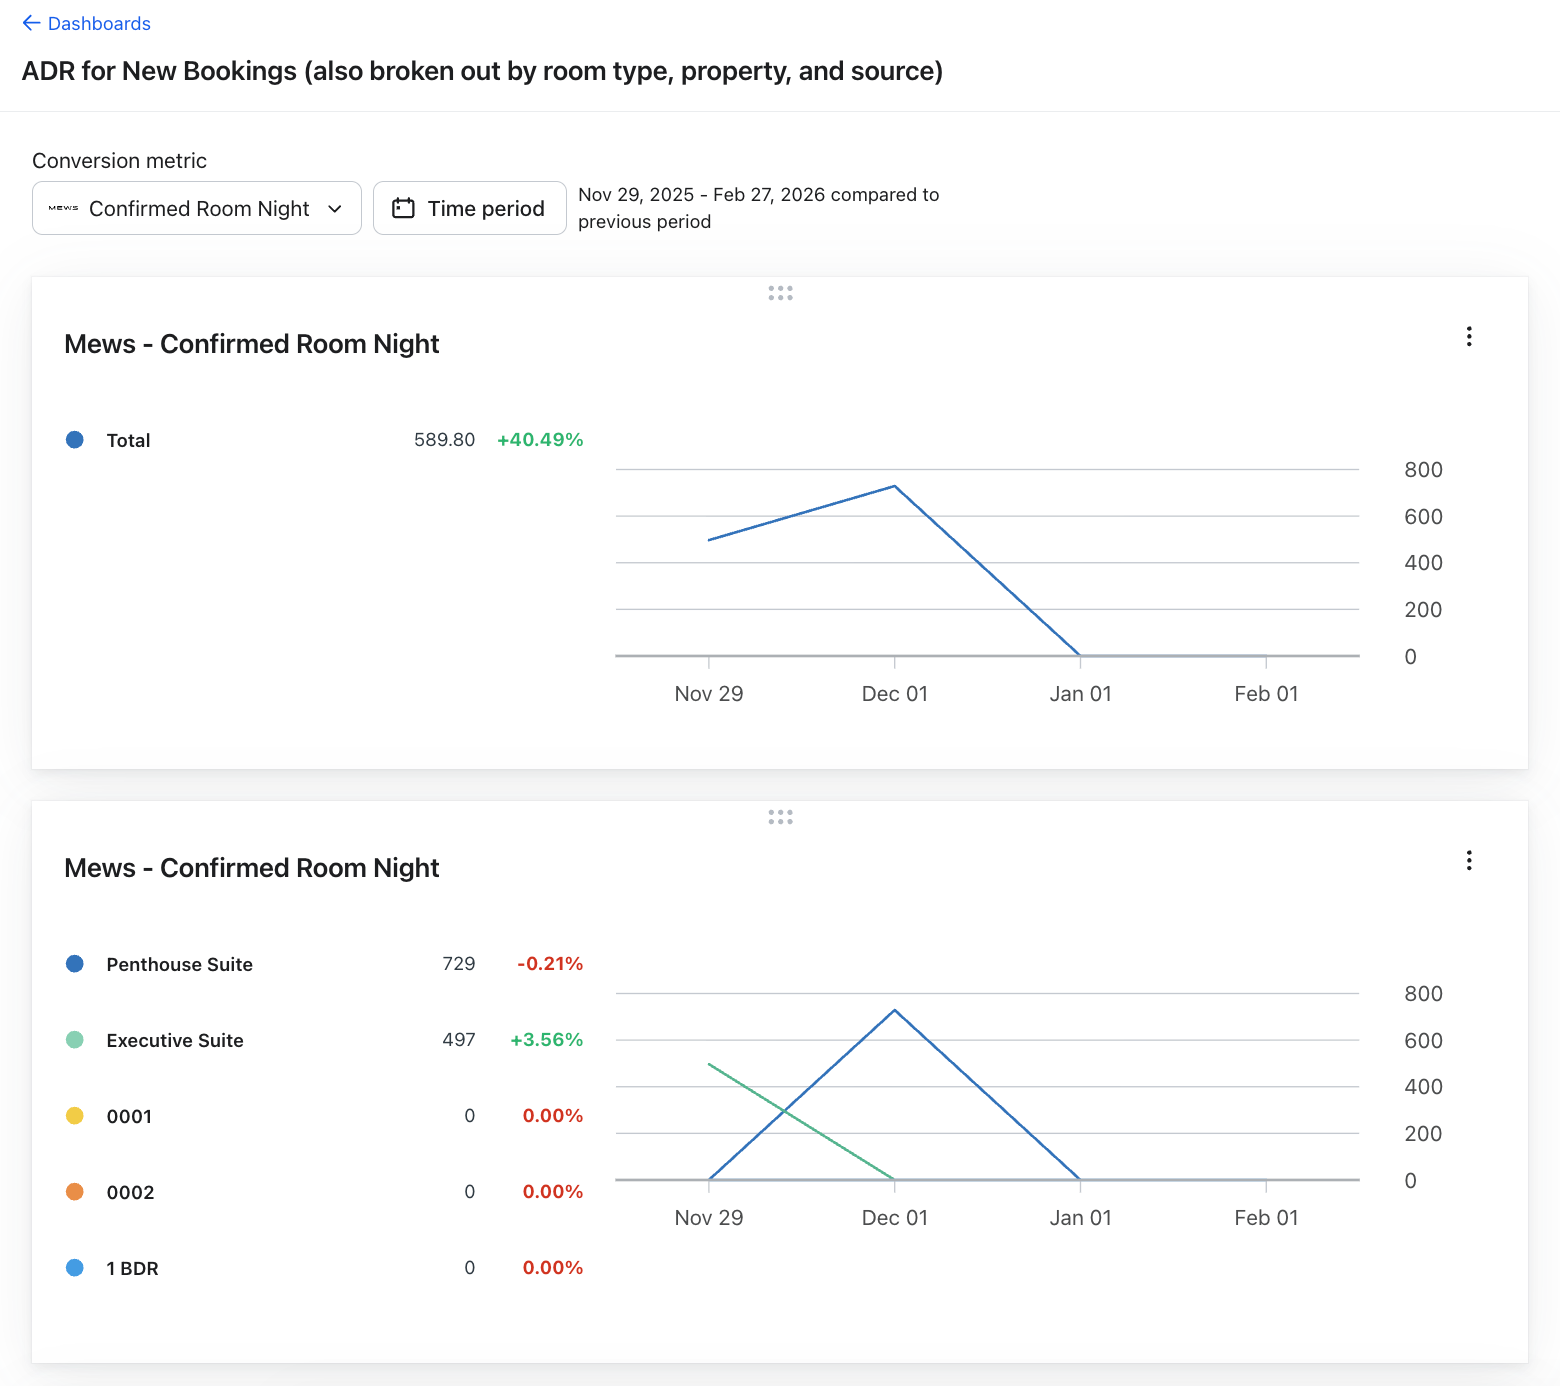
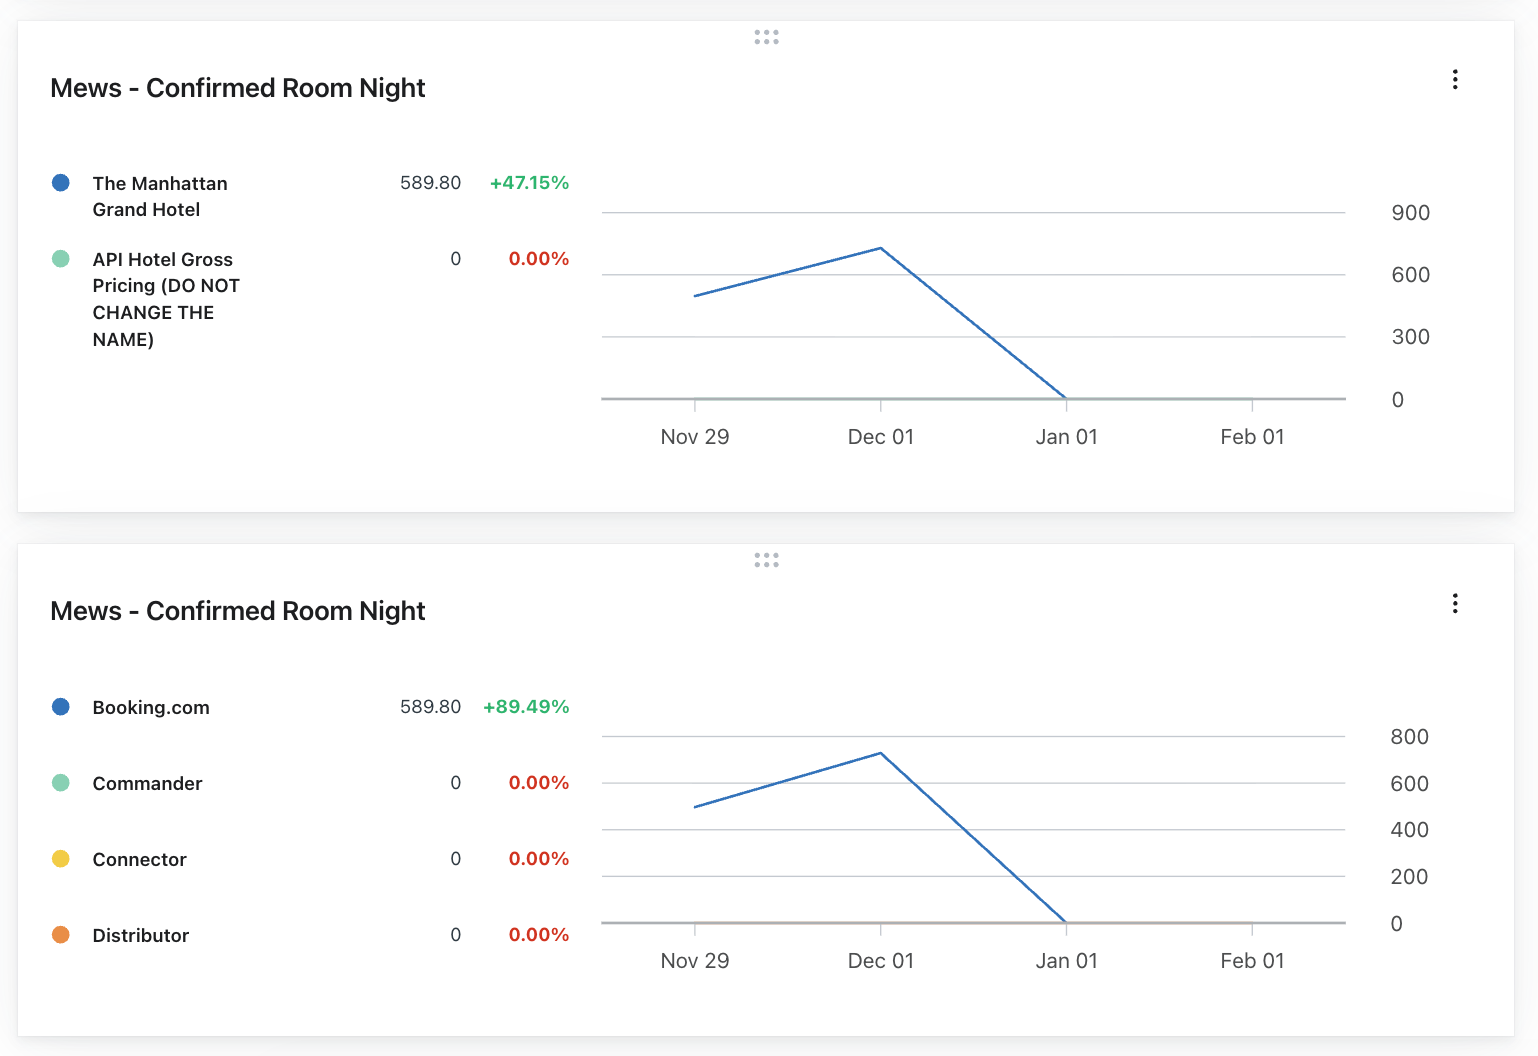
This dashboard shows the ADR for newly confirmed bookings — answering "what are guests willing to pay at the time they book?" Use this to monitor changes in booking value alongside your campaigns and flows. These cards include all synced room nights, not only bookings attributed to Klaviyo messages. At the end of these steps, your dashboard for average daily rate will look like this:
Steps
- Navigate to Analytics > Dashboards and click Create Dashboard.
- Enter a name, such as ADR from New Bookings, and click Create Dashboard.
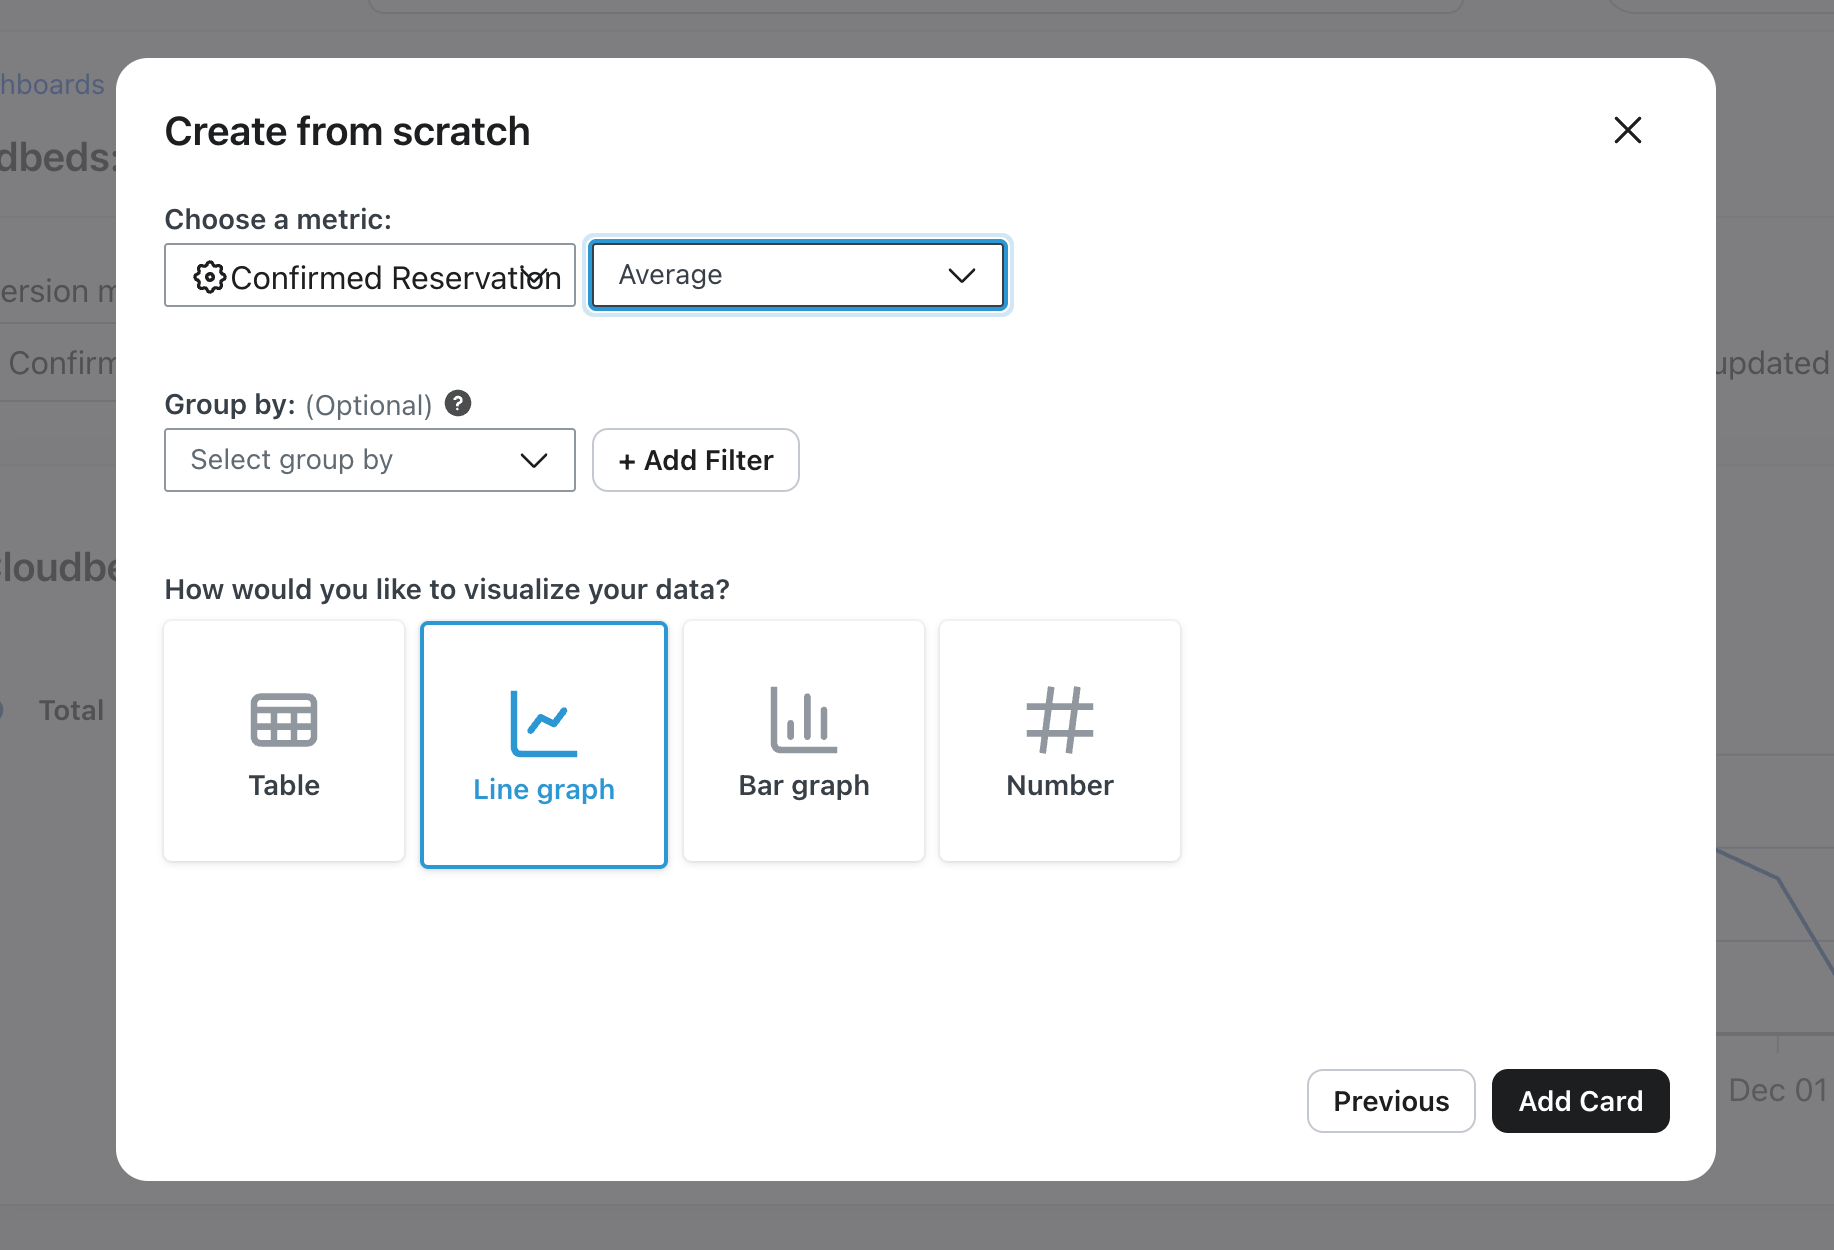
- Click Add card > Create from scratch.
- Select the metric, measurement, and grouping listed for the card below. Leave Group by blank for Card 1, and choose Line graph.
- Click Add Card. Repeat steps 3–5 for the remaining 3 cards below.
Add Card 1 — ADR from New Bookings
- Metric: Confirmed Room Night
- Measurement: Average (average room-night revenue)
- Group by: (none)
Add Card 2 — ADR by Resource Type
- Metric: Confirmed Room Night
- Measurement: Average (average room-night revenue)
- Group by: ResourceName
Add Card 3 — ADR by Origin
- Metric: Confirmed Room Night
- Measurement: Average (average room-night revenue)
- Group by: Origin
Add Card 4 — ADR by Property Name
- Metric: Confirmed Room Night
- Measurement: Average (average room-night revenue)
- Group by: PropertyName
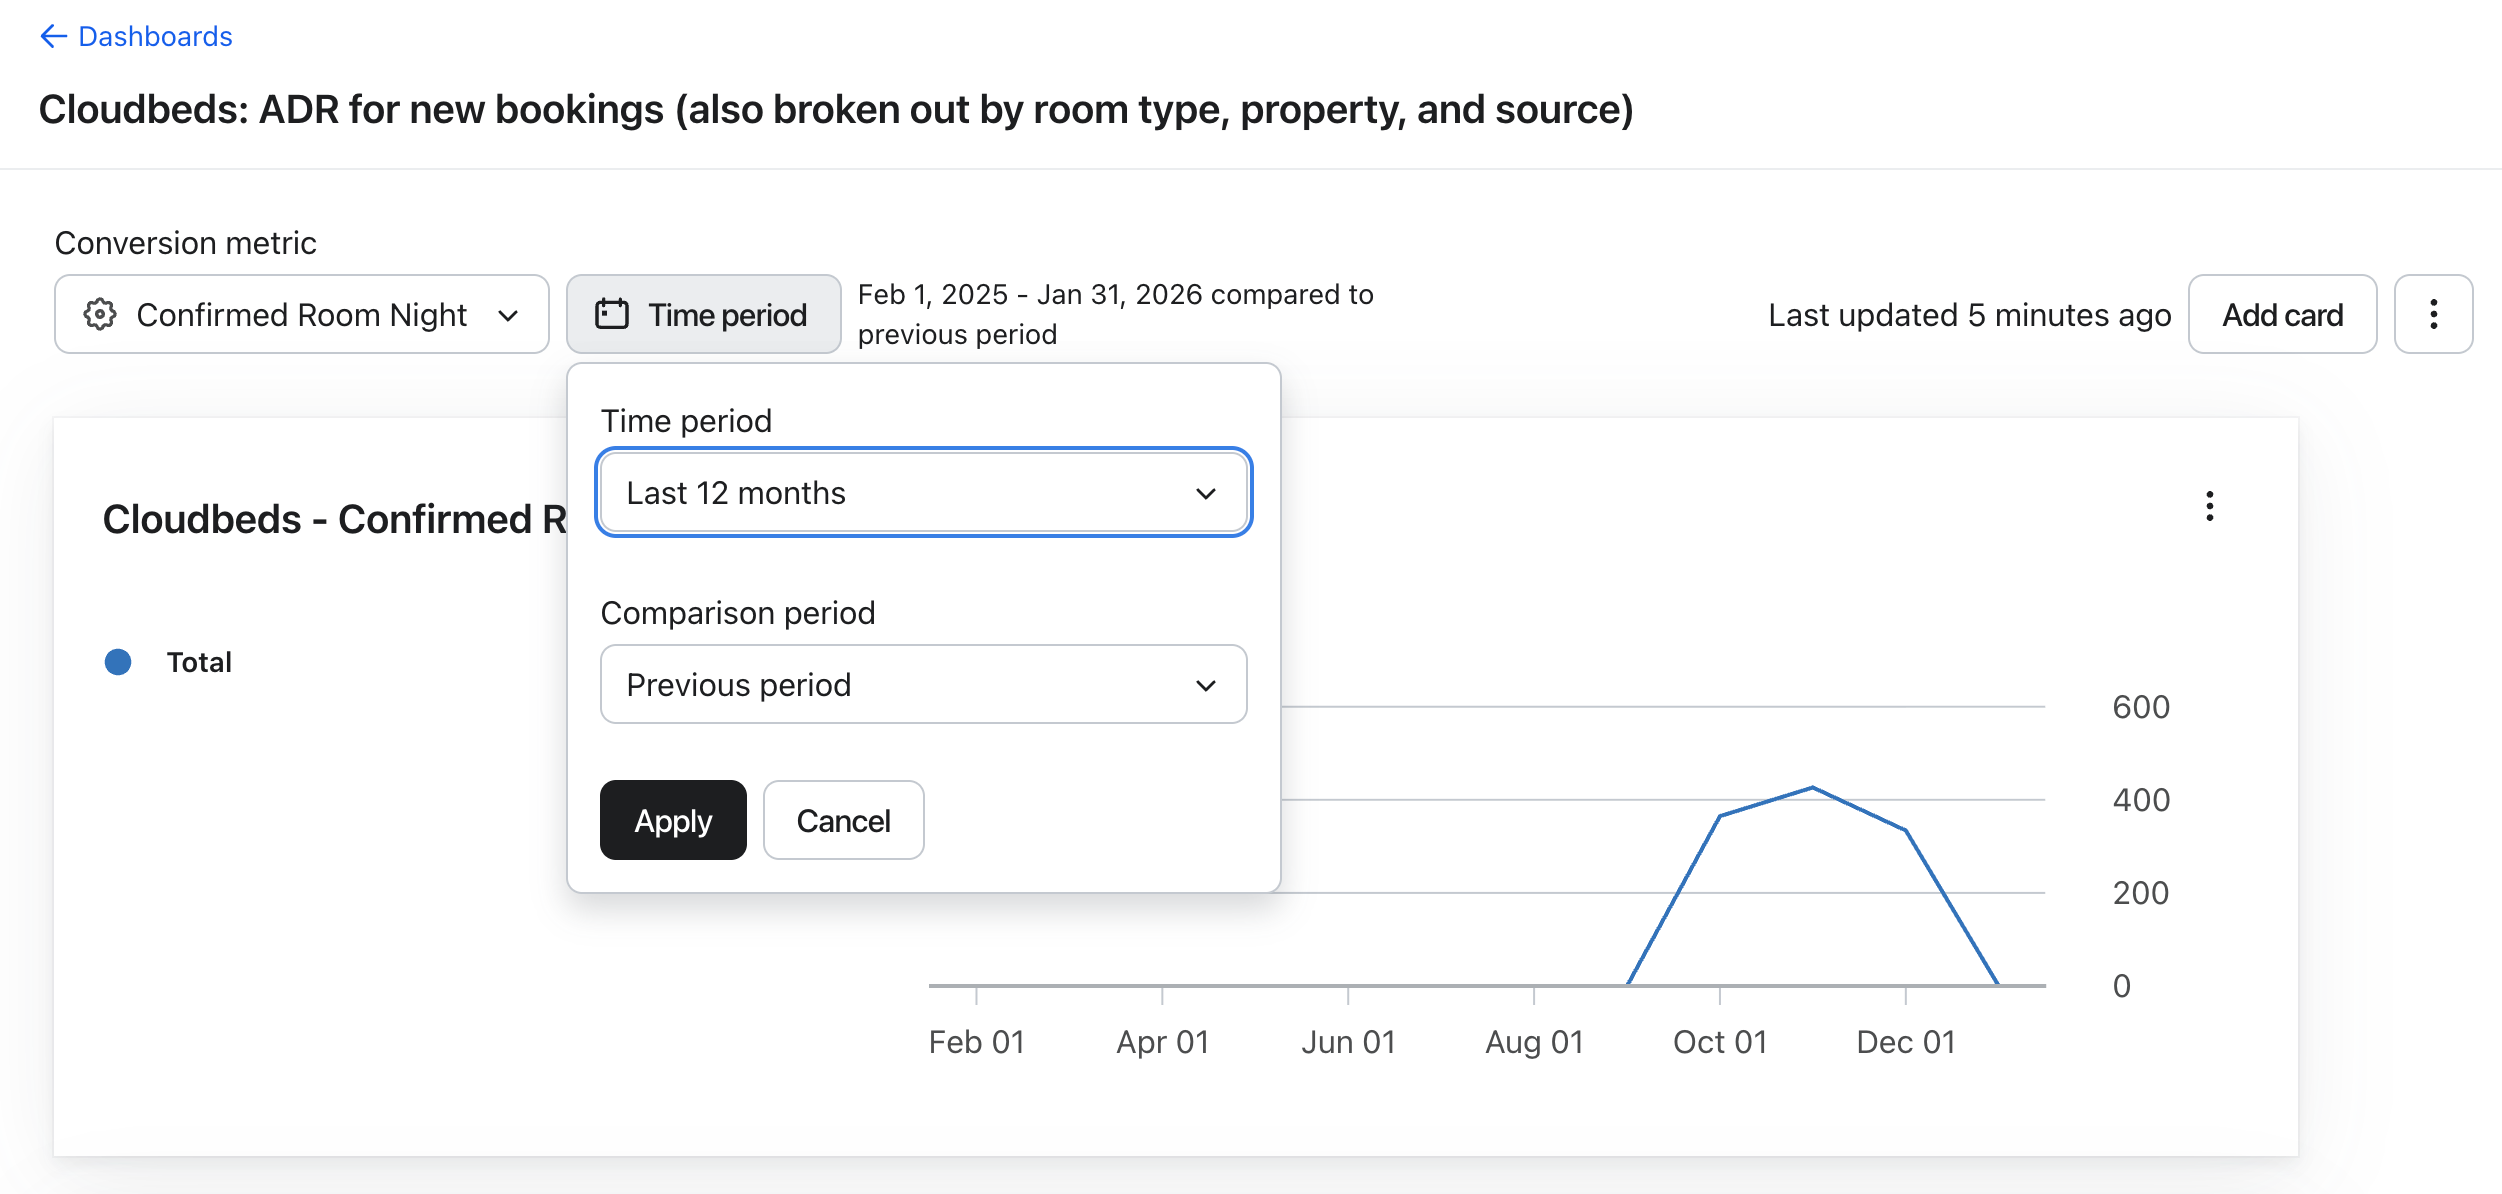
Click Time period, choose your date range and comparison period, and click Apply. Use Last 30 days to see daily data.
Understanding the metrics
For these metrics, Value adds the room-night amounts. Average divides that total by the number of room-night events in the selected period to calculate ADR.
Confirmed Room Night events sync when a reservation is confirmed. Their event dates use the reservation update time recorded by Mews, rather than the future stay dates. Use StartDate to identify the night of the stay.
Completed Room Night events sync after checkout and are dated to 11:59 p.m. on each stay night in the property’s timezone. Dashboard dates use your Klaviyo account timezone, so a different account timezone can shift the displayed date.
Property | What It Means |
|---|---|
$value | The nightly room rate for that specific night |
PropertyName | The name of the hotel property |
Origin | Where the booking came from (e.g., Commander, ChannelManager, Connector) |
ResourceName | The room type or name (e.g., Executive Suite, Deluxe Queen) |
StartDate | The calendar date the night begins |
Each room-night metric counts 1 event per room per night. For example, 2 rooms for 2 nights produce 4 events for each applicable room-night metric. You can filter or segment on any individual night, not just the overall reservation. See the Mews data reference for the full list of event properties.