Understanding the Helpdesk reporting dashboard
Learn how to interpret each section and metric on the Helpdesk reporting dashboard.
You can use the Helpdesk reporting dashboard to monitor support ticket volume, measure agent performance, and identify trends in customer support activity.
About the Helpdesk reporting dashboard
The Helpdesk reporting dashboard displays key metrics related to ticket management, support volume, and agent performance. You can use this data to monitor trends, evaluate team efficiency, and identify areas for process improvement.
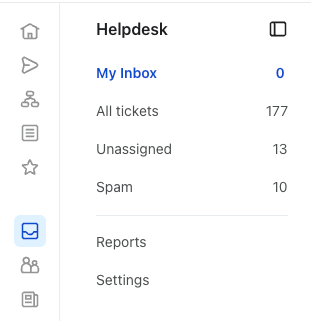
To access the Helpdesk reporting dashboard, navigate to Service > Helpdesk, then click on the Reports section.
Use the time period selector at the top of the dashboard to set a date range and comparison period. All displayed metrics will reflect your selected time frame. Note: Dates are inclusive; if today is February 1 and you choose "Last 7 days," metrics reflect activity from February 1 through February 7.
Navigating the Helpdesk reporting dashboard
The Helpdesk reporting dashboard includes the following main sections:
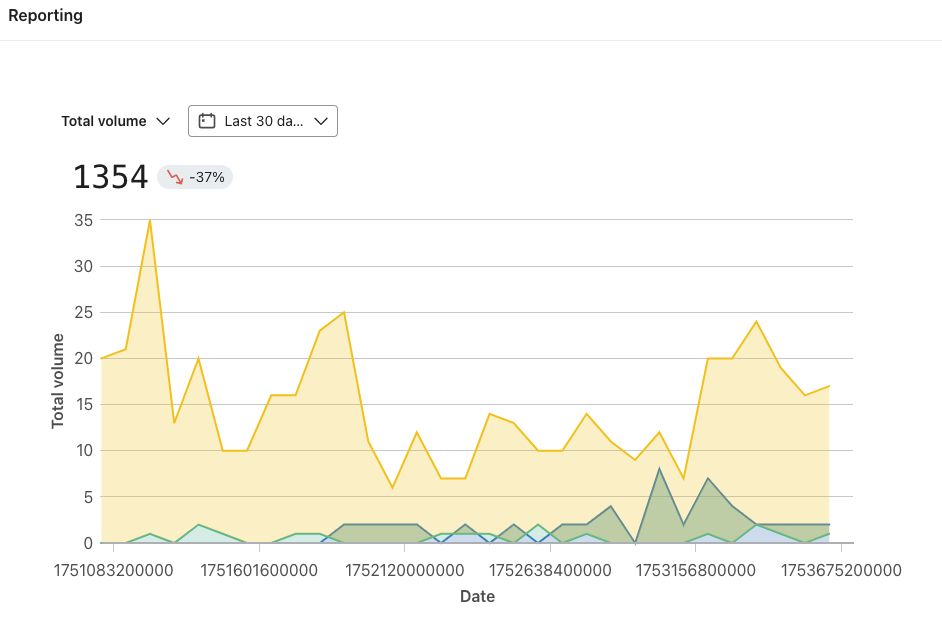
Graph view of support metrics
At the top of the dashboard, you can view a graph of your support performance metrics over time and per channel to analyze trends for each metric individually. The graph defaults to showing ticket volume over time; however, you can use the dropdown menu above the graph to select different metrics for display (i.e., to view resolved tickets, average response time, or average resolution time).
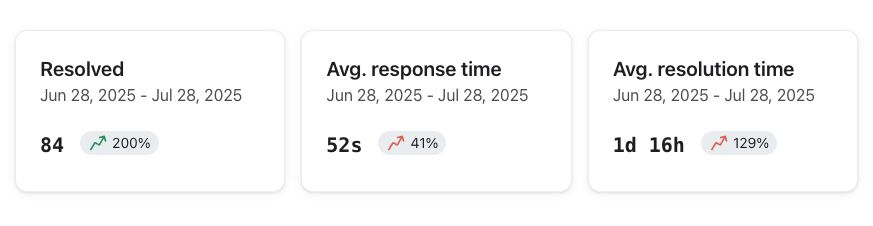
Metric cards
Below the graph, you’ll see the following metrics, which provide key indicators of your support team’s workflow and efficiency in ticket resolution:
- Resolved: Number of tickets resolved during the selected range. This also includes percent change versus the previous period.
- Avg. response time: The average time it takes for a support agent to respond to customer messages within a ticket.
- Avg. resolution time: The average time it takes to fully resolve a ticket.
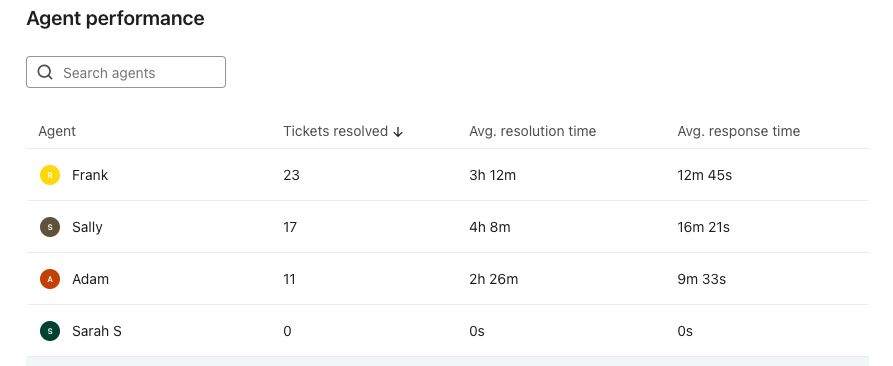
Agent performance table
The Agent performance table details individual support agent activity for the chosen timeframe. Columns include:
- Agent: Name or username of the agent.
- Tickets resolved: Total tickets resolved by the agent in the selected period.
- Avg. resolution time: The agent’s average resolution time for resolved tickets.
- Avg. response time: The average time between a new ticket and the agent’s first reply.
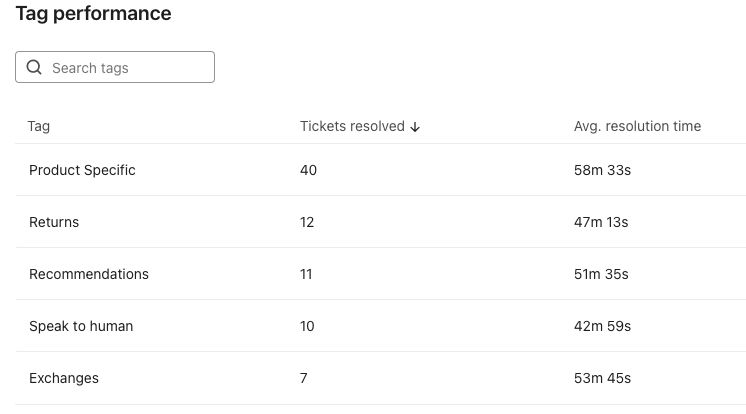
Tag performance
Tickets can be assigned tags that describe topics or reasons for contact (e.g., "Returns", "Pricing"). The Tag performance table helps you understand how these different categories of requests are being managed. Columns include:
This table is broken into the following columns:
- Tag: The classification or topic assigned to each ticket
- Tickets resolved: Number of tickets with this tag resolved during the period.
- Avg. resolution time: Average time required to resolve tickets with this tag.
Reviewing and acting on your data
Regularly review the reporting dashboard to track support trends and identify potential issues. If you notice unusual trends or unexpected results:
- Confirm you are viewing the correct reporting period using the date range selector.
- Review the agent and tag performance tables to identify outliers or categories with longer resolution times.
- Assess your ticket management processes if you notice high resolution times or response times.
Additional resources
- Guide to Klaviyo Helpdesk
Learn about Klaviyo Helpdesk, which helps you manage support conversations across all channels, powered by the data you already have in Klaviyo.
- How to assign tickets in your Klaviyo Helpdesk
Learn how to assign tickets within your Klaviyo Helpdesk to efficiently manage customer inquiries and delegate responsibilities among your support team. By understanding views in Helpdesk and assignment actions, you can ensure efficient, organized customer support operations.
- How to create and use macros for Helpdesk tickets
Find out how to create and use macros (previously called “quick responses”) in tickets in Klaviyo Helpdesk. Macros are pre-written, reusable responses your support agents can insert into replies for SMS and web chat tickets.