How to build a flows performance report
You will learn
The flows performance report provides a thorough analysis into flow-specific engagement and conversion information. This reports helps you get up and running quickly with flows by including all standard engagement and deliverability metrics grouped by flow name. You can tailor this report to your needs by customizing the metrics you want to analyze and focusing that analysis using tags and time range filters.
The flows performance report can help you answer questions like:
- How has my welcome series performed over the last year?
- How has each message within my abandoned cart flow performed across multiple engagement metrics in the last month?
- Are any flows seeing more or less sending activity than usual over the last 90 days? Is this present in my recent Placed Order Rate and revenue generated?
In this guide, you will learn more about the Flows Performance Report, where to find it in Klaviyo, and how to customize it to better serve your brand.
Build the report
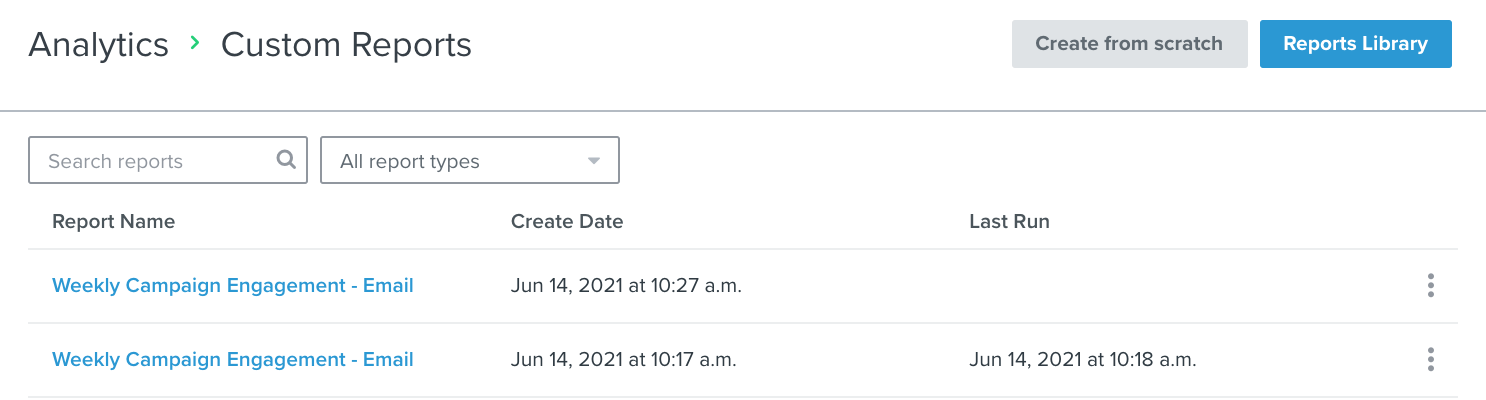
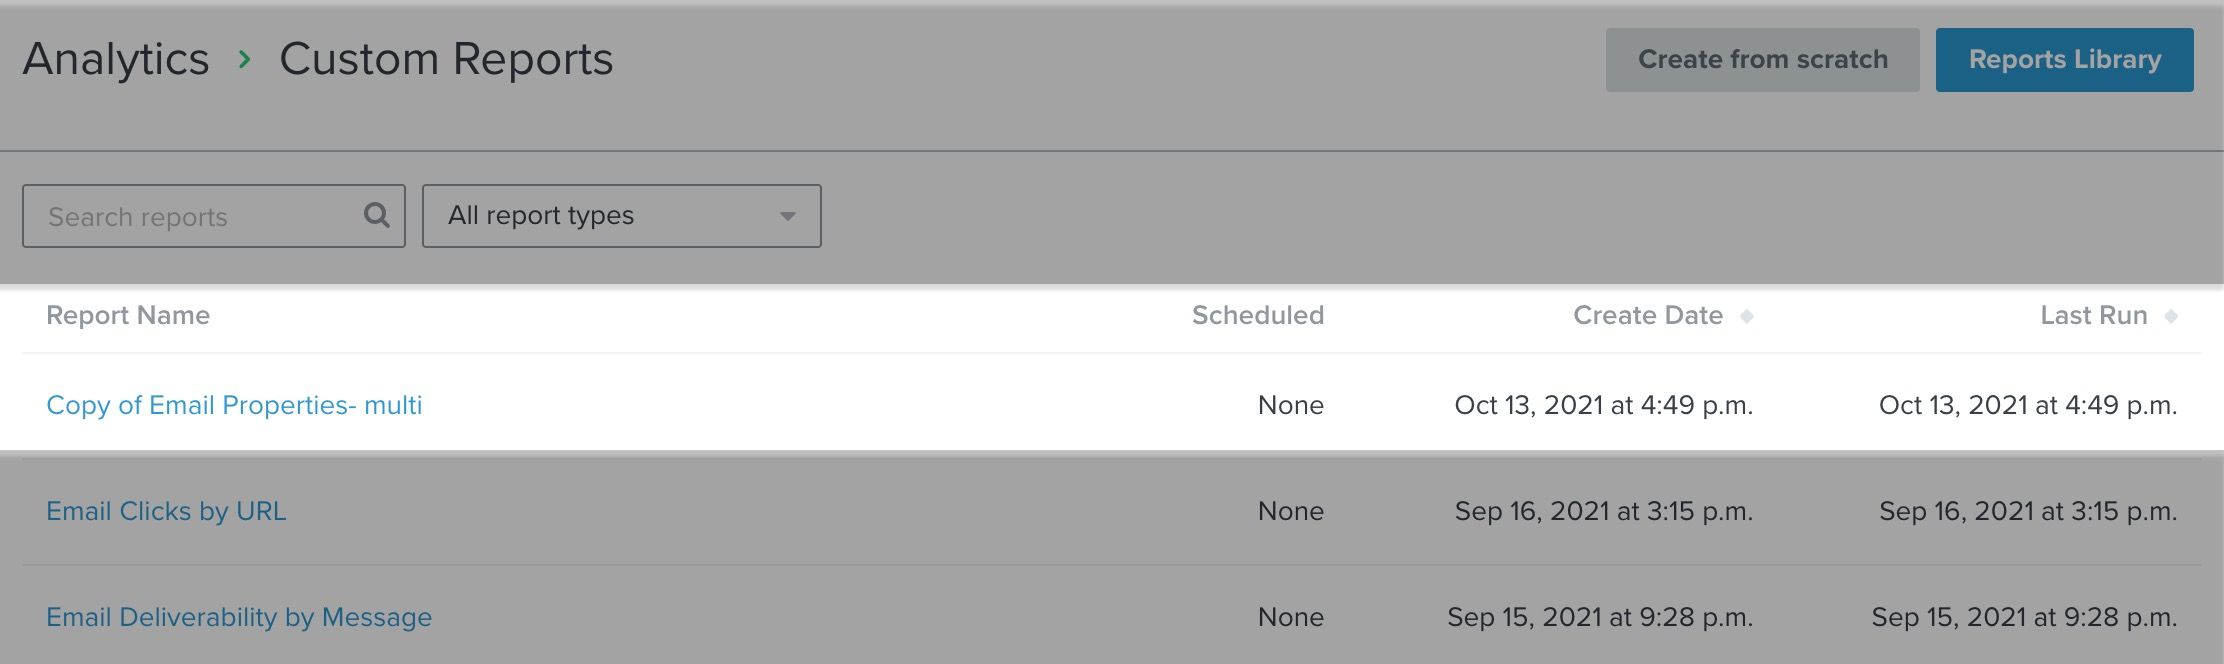
1. Navigate to Analytics > Custom Reports.
2. Either browse the library of pre-built reports or click Create from scratch.
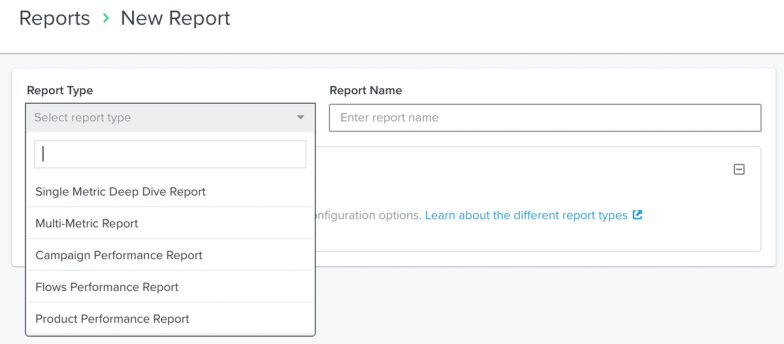
3. Under Report Type, select Flows Performance Report from the dropdown and give your report a name.
Customize the report
Once you have chosen your report, you can customize it to best serve your business needs. By default, the report is pre-populated with the standard deliverability and engagement metrics related to your channels in Klaviyo. If you employ both SMS and email, you will see both SMS and email metrics appear.
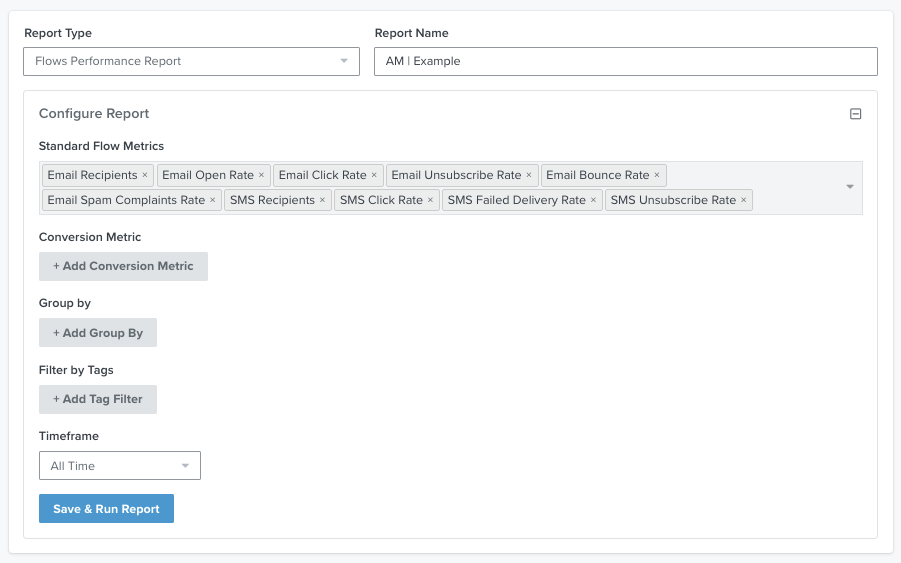
1. If any pre-populated metric is irrelevant to your needs, you can remove it by clicking the X to the right of the metric’s name. To re-add any of these defaults, click within the gray box and re-select them from the dropdown menu.
You may also add up to 10 conversion metrics in addition to the pre-populated set that comes with the report. This includes both standard conversion metrics (e.g., Placed Order) and conversion rates (e.g., Placed Order Rate) that are attributed to your messages.
Note that Total Recipient data will include email deliveries plus bounces, and Open Rates are the number of unique opens divided by deliveries.
Note that SMS ROI, SMS Usage, and SMS Spend is only available starting on October 1, 2025. SMS ROI and SMS Spend are only available for non-contracted SMS customers, contracted SMS customers will see 0's for all these flow metrics for all time periods periods. SMS ROI Is computed using attributed revenue from the mapped revenue metric.
2. Click + Add Conversion Metric to add these parameters to your analysis.
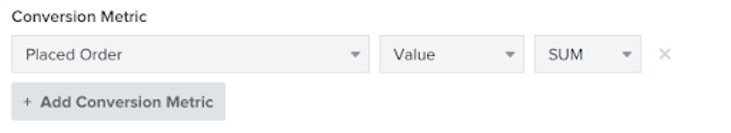
3. Once you have customized your report and added your desired conversion metric, the next step is deciding how you want to analyze those conversion metrics. Except for rates, all conversion metrics support two different dropdowns to customize your analysis:
- Total, unique, or value
You can report on the total number of instances of an event (Total) or the unique number of profiles that performed that event (Unique). If the metric you select has a monetary value associated with it (e.g., Placed Order), you can also report on the value of the events (Value). - SUM or AVG
You can choose one of two aggregations: SUM or AVG. SUM shows you the total of all events for your selected metric. For example, if there are two Placed Order events within the time span you select, both with a $15 value, the VALUE SUM will be $30 and the TOTAL SUM will be 2. AVG shows the average of events that occurred for your metric. For example, if there are two Placed Order events within the time span you select, both with a value of $15, the average will be $15.
4. You can add a modifier to group and filter your report by specific values. This allows you to build a more tailored report around your selected metrics, specific to your business needs. These modifiers include:
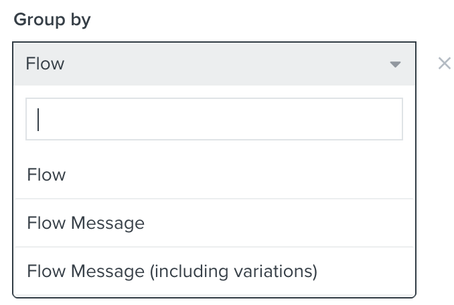
- +Add Group By
You can group your report values by flow, flow message, or flow message (including variations). If you do not add a group by element, each flow will have two rows with one for email and one for SMS.- Flow
Rates will appear as weighted averages of each metric to account for overall flow performance. For example, a weighted average of the open rates to account for each message’s performance in a welcome series. - Flow Message
Data will be grouped by the individual messages of your flows. For example, Open Rate will be displayed for each message in a welcome series rather than the flow performance as a whole. - Flow Message (including variations)
Data will be grouped by the individual messages of your flows. For example, Open Rate will be displayed for each message in a welcome series rather than the flow performance as a whole.
- Flow
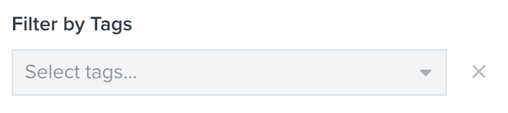
- Filter by Tags
The flows performance report supports filtering by tag. For example, if you only want to view data from a specific flow, you can do so by selecting the desired tag from the dropdown menu, as shown below. You may select multiple tags at once, separated by the AND connector.
5. Finally, customize the timeframe of your report so that it only shows the data you care about. To adjust the timeframe, choose your selected time range and grouping from the associated dropdowns.
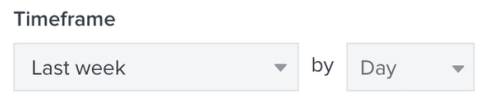
You can adjust the time range to:
- Today
- Last 24 Hours
- Yesterday
- This Week
- Last 7 Days
- Last Week
- This Month
- Last 30 Days
- Last Month
- This Year
- Last 90 Days
- Last 365 Days
- Last Year
- Custom
You can also group the data by:
- Daily
- Weekly
- Monthly
- Yearly
Note that timestamp data within your reports, including exported reports, will display in your account's local time from your settings. Additionally, if you are using custom date ranges, the maximum time range is 2 years. If you attempt to create a report with over 2 worth of data, an error will appear.
Run and export the report
Once you customize your flows performance report to include all of your desired engagement, deliverability, conversion metrics, and filters or modifiers, you’re ready to run your report.
Note that message ID and experiment variation are different properties used in UTM tracking. Message ID refers to the overarching ID number of the message, while experiment variation refers to the ID associated with a specific A/B test version. Currently, only message ID will appear in report downloads. However, both message ID and experiment variation will appear in your Google Analytics data.
1. Click Save & Run Report. This will process your report and save it in your account.
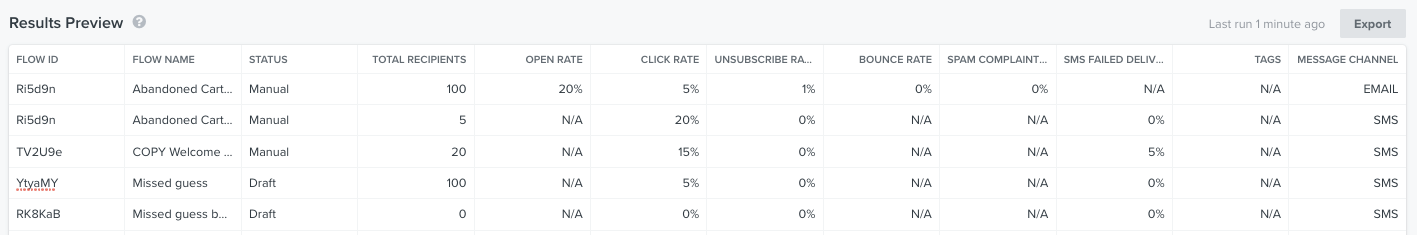
While it may take some time to populate your results, when it is complete, you will see a robust summary of your report. Your new report will automatically be saved, so you may navigate away and return to your report from within the Analytics tab at any time.
Once your report populates, the configuration box will automatically collapse so you can focus on identifying performance trends and opportunities. A timestamp of when the report was last run will appear above your results.
2. To export the results of your report for further analysis, click Export.
Schedule your reports
You also have the option to schedule a report to auto-run at a specific date and time and be notified via email when your results are ready. This way, you can set up your reports to automatically run and pull data for your review instead of manually exporting them.
Learn how to schedule reports automatically in Klaviyo.
Update report results
It's important to recognize that reports do not automatically refresh. Rather, you will need to manually re-run the report to pull updated data. To see when a report was last updated, look at the Last Run timestamp from either the Analytics tab or from within the report itself.
1. To update your report to display the latest data, reopen it and click Run Report.
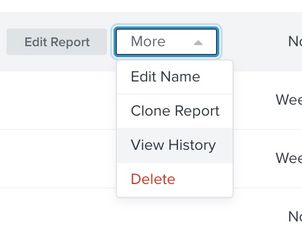
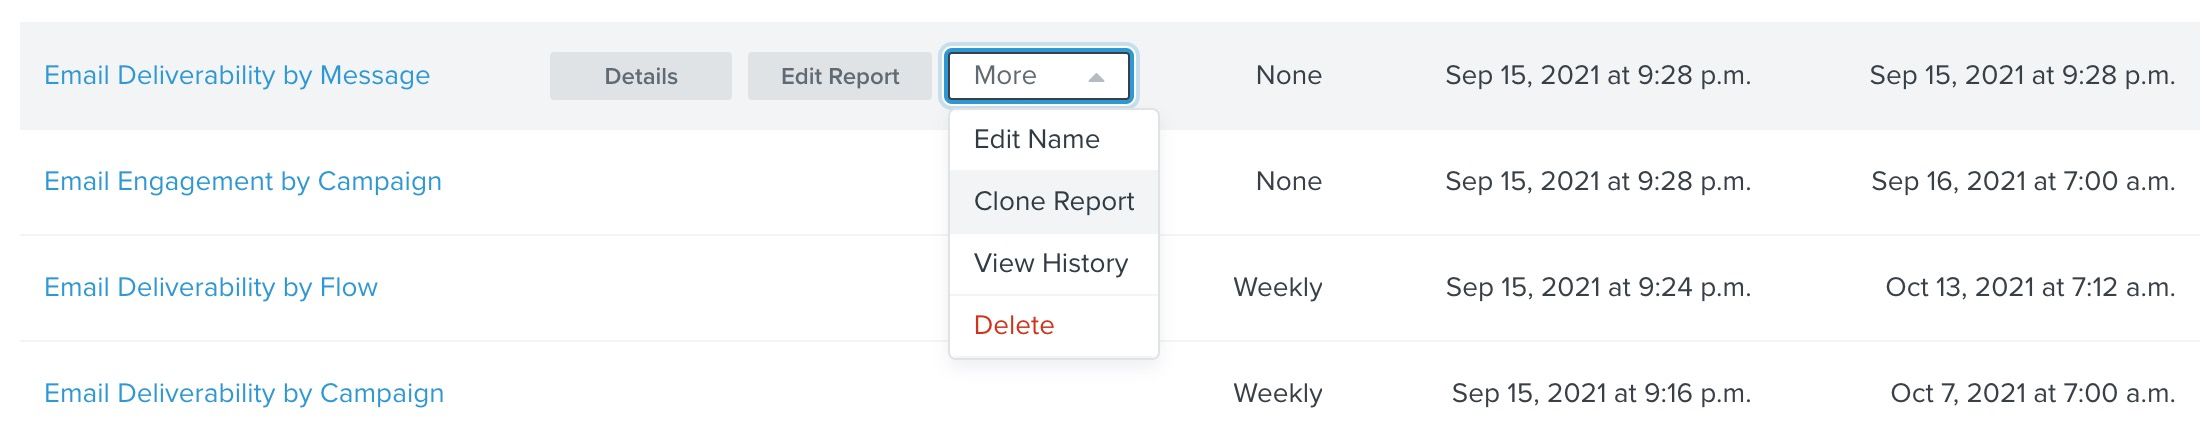
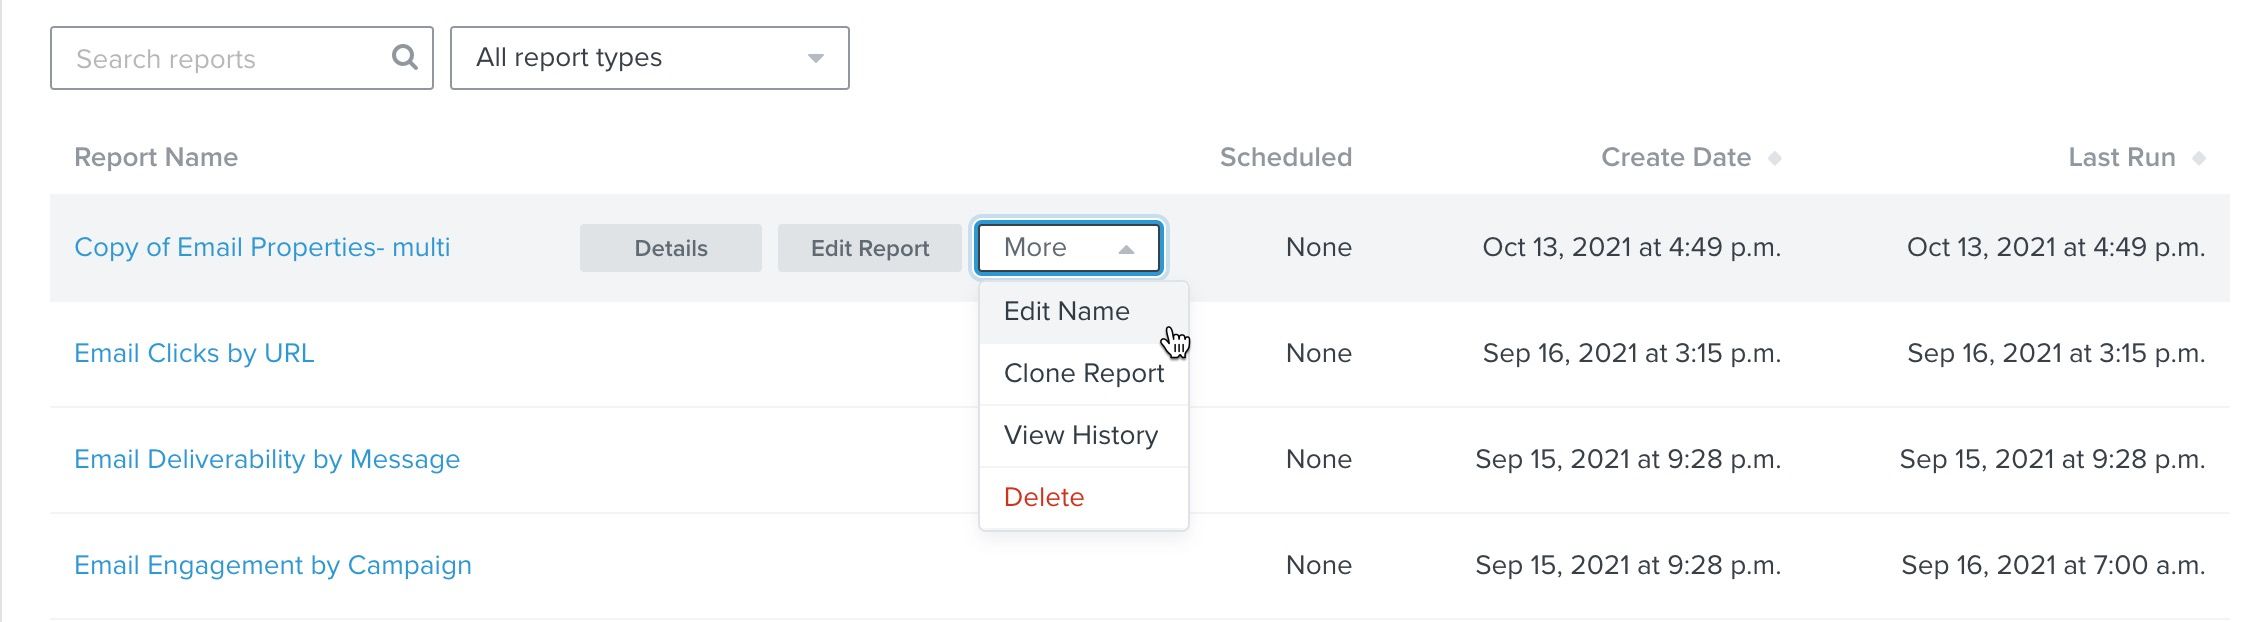
2. If you need to see historical report results from previous runs, go to Custom Reports and click More.
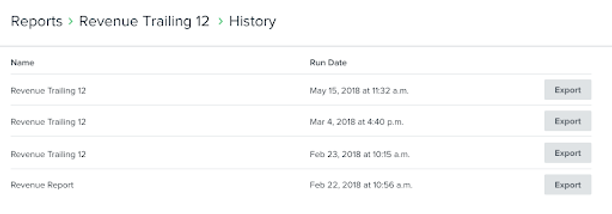
3. Choose View History from the dropdown menu.
This will show all historical runs for your report of interest.
4. To download the historical results of your report, select Export.
Clone and rename reports
If you have an existing report that you would like to copy, use the clone option.
1. Go to Custom Reports and find the report that you want to clone.
2. To the right of the report, click More and then choose Clone Report from the dropdown menu.
Note that cloned reports do not include scheduling preferences from the original report. If you would like to schedule your copied report to deliver to you on a regular cadence, head to our guide on how to schedule custom reports.
3. If you would also like to rename your cloned report, navigate to the right of the report and click More.
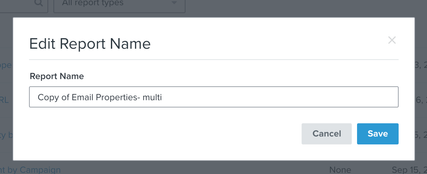
4. Choose Edit Name from the dropdown menu.
5. Rename your report in the modal that appears. Once you have renamed your report, click Save.
Additional resources
- Getting started with custom reports in Klaviyo
Learn how to use Klaviyo custom reports to monitor your business' health across each of your marketing channels and individual products or services. By using these reports, you can leverage your data to uncover trends in customer behavior, align your team around a cohesive marketing strategy, and grow your business as you act upon new insights.Just starting out with Klaviyo reporting? Learn more about feature-specific reports and get a general overview of Klaviyo’s analytics tools.
- Understanding flow analytics
Learn how to review the performance of your Klaviyo flow messages, including open, click, and conversion rates.
- How to build a campaign performance report
Learn more about the campaign performance report, where to find it in Klaviyo, and how to customize it to better serve your business. The campaign performance report lets you deep dive into campaign-specific engagement and conversion data. This reports helps you get up and running quickly by providing a pre-made report that includes all standard engagement and deliverability metrics neatly grouped by campaign name. Tailor it to your needs by customizing the metrics you want to analyze and focusing that analysis using tags and time range filters.
- Getting started with reporting
Learn about the different robust Klaviyo reporting tools available in your account. Klaviyo is built to help your business grow and strengthen your relationships with your audience by putting data to work. Segmentation and automation tools allow you to personalize and target your communication efforts across channels to boost engagement and drive business growth. However, in order to understand how well your business strategies and marketing efforts are working, you need proper reporting to measure and analyze performance trends over time.