Getting started with Marketing Analytics
You will learn
Learn about Klaviyo’s Personalization product. Personalization provides actionable customer and product insights that enable you to enrich your marketing strategy with additional data and use cases for better personalization.
Before you begin
Personalization is separate from Klaviyo’s email and profile plans, and you must have both to access the functionality. If you already have Advanced KDP, these features are included, so you do not need a separate Personalization subscription. Head to our billing guide to learn more about this plan or get started if you are a new customer.
What is Personalization?
Personalization is an add-on product to Klaviyo that provides you with actionable customer and product insights to power smarter marketing. While Klaviyo already includes robust performance reporting, the additional insights you can gain from Personalization enable you to better drive retention, revenue, and relationships at scale.
Purchasing Personalization
New Klaviyo customers
If you are a new customer, you can purchase Personalization alongside an email plan.
Existing Klaviyo customers
You need permission to manage billing to follow these steps. If your account is on a manually billed contract, contact your Klaviyo representative to purchase Personalization.
To purchase Personalization:
- Navigate to your account in the bottom left corner and select Billing.
- On the Overview tab, select Change plan to open checkout.
- Open the Personalization plan dropdown and choose a plan for your active profile count.
- Click Continue to payment.
- Review your billing and payment information and the subscription details, then click Confirm and Pay to complete your purchase.
Billing
Personalization is not included in Klaviyo’s base email and profiles plan. You can access these features with a Personalization or Advanced KDP subscription.
Personalization is priced based on your active profile count, starting at $100 per month for up to 13,500 active profiles.
Learn more about how Klaviyo bills for Personalization.
Interface
You can find Personalization in Klaviyo’s left-hand navigation menu.
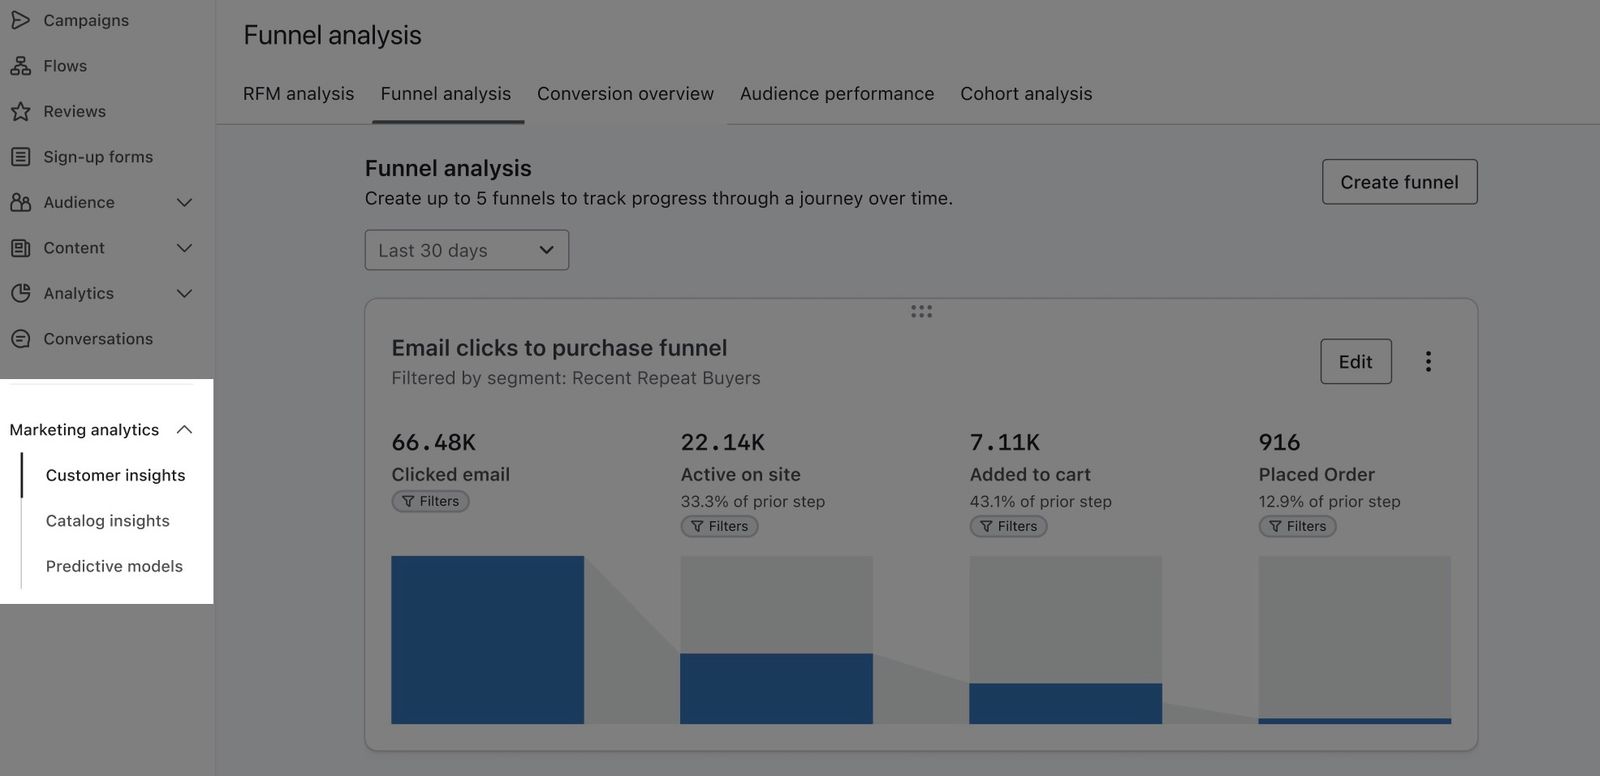
Under Personalization, use the following sections to access the features covered in this article:
- Customer insights
- Catalog insights
- Predictive models
Personalization feature set
Funnel analysis report
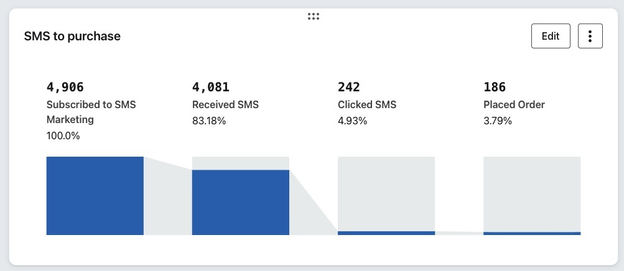
The funnel analysis report provides the ability to see where customers may be dropping off in their journey with your brand. The report allows you to set up and analyze the specific steps of a customer’s marketing journey and the number of customers who reach each step.
For example, you may create an analysis that starts with customers who Placed Order, then Fulfilled Order, and finally Refunded Order, as shown below.
Within this analysis, you can review a breakdown of the number and percentage of customers who reached each step and see where you can optimize your marketing efforts.
Conversion overview
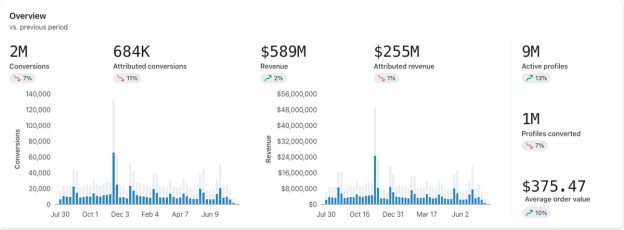
The conversion overview dashboard enables you to analyze your total conversions and revenue, including Klaviyo attributed values. You can also review how many profiles are completing different numbers of conversions and the total revenue they represent. This dashboard enables you to optimize marketing efforts and increase conversion rates by targeting specific segments based on conversion behaviors.
RFM analysis report
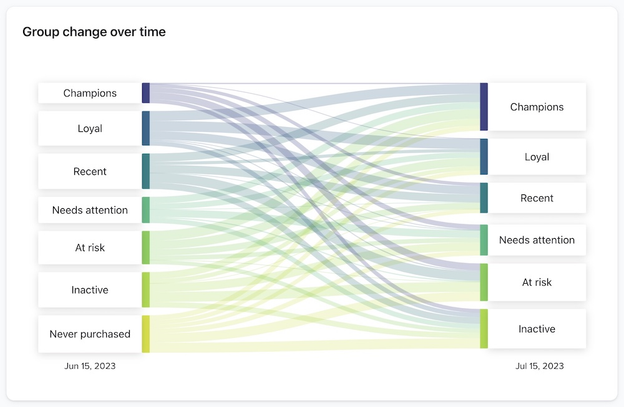
The recency, frequency, and monetary values (RFM) report provides deep customer insights based on purchasing behaviors and automatically categorizes these behaviors and customers into groupings (e.g. Loyal customers).
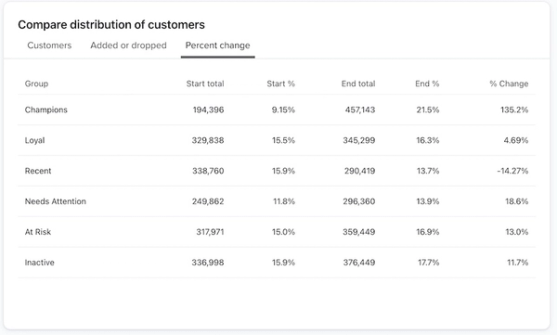
These groupings enable you to analyze customer behavioral patterns over time and identify areas where you can optimize your marketing strategies.
For those customers who may be at risk, you can also use these insights to drive winback campaigns and reduce churn.
Audience performance summary report
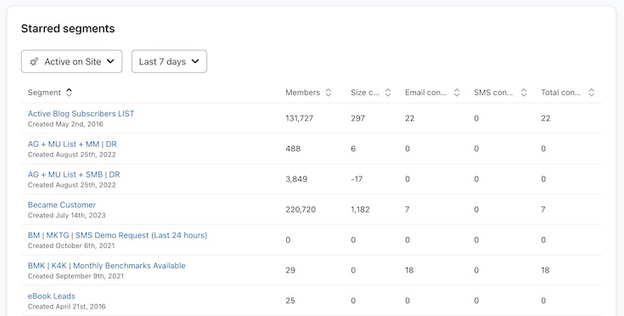
By assessing the performance of your starred segments, the audience performance summary lets you quickly spot segments that are performing successfully and unsuccessfully. The report provides detailed information on:
- Each of your starred segments
- Their overall success per channel
- Their total conversions or revenue
From here, you can use these insights to tailor marketing efforts toward underperforming segments. Examples of some of this report’s features are shown below.
Cohort analysis
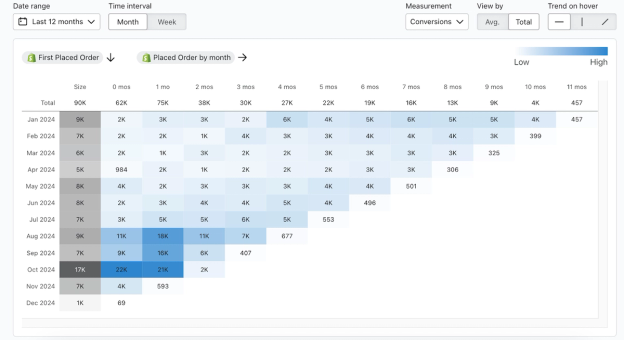
The cohort analysis allows you to take a group of profiles with common characteristics (i.e., a cohort) and analyze their behavior over time. This allows you to identify trends and patterns in engagement, conversions, and other key metrics across their lifecycle.
Some examples of customer behaviors you can track with a cohort report include:
- Repeat purchase behavior
- Customer retention
- Purchasing behavior after subscribing
Catalog insights
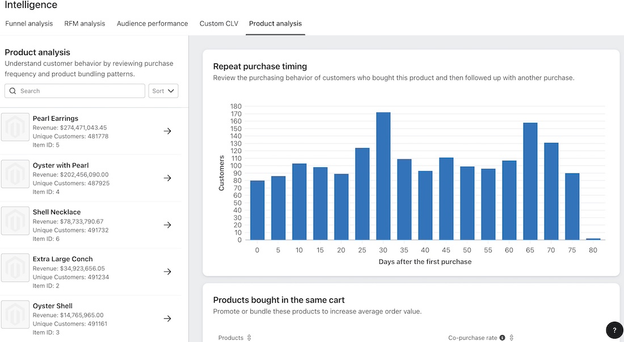
The product analysis dashboard allows you to better understand customer behaviors related to specific product purchases, and craft marketing to match these pathways.
You can review insights around how, what, and when products in your catalog are driving orders, and align products at the right time in the customer journey.
Some methods you can strategically use product analysis insights include:
- Adjust post-purchase flow timing
Set up a flow triggered off of a purchase event and add a wait step based on insights from the Repeat purchase timing card. - Adjust post-purchase flow content
Set up a flow triggered off of a purchase event to promote a product recommendation from insights in the Products bought in the next order card. - Automate recommended bundles/co-purchases
Set up a flow triggered off of an abandoned cart event with a reminder to purchase and a product recommendation from Products bought in the same cart card. - Inform your merchandising strategy
Identify the best products to promote together or in succession in campaigns based on Products bought in the next order or Products bought in the same cart cards.
Additionally, the product analysis dashboard creates 2 predictive profile properties in the Predictive Analytics section of a profile. These properties are:
- Best cross-sell date
The product analysis report determines the best timing to attempt to cross-sell to profiles. The Best cross-sell date property requires customers to have made at least 1 purchase, and is based on the purchasing patterns of similar customers that have bought the same item. This is a dynamic property that updates daily, but only when a profile makes a purchase. - Next best product
The product analysis report also determines the next best product for profiles based on their last purchase. As a profile continues to place orders, this property will automatically update accordingly. The Next best product automatically excludes unavailable items, as well as the first 48 hours of repeat purchase data for a profile. The first 48 hours after a purchase generally has the highest volume of returns and exchanges. Excluding data captured during this timeframe prevents the Next best product property from being skewed.
You can take advantage of this profile property in email sends through the Next best product block. This product block will dynamically show each recipient the next best product they are most likely to purchase based on their last purchase. If a personalized recommendation is unavailable, the block can show a fallback product.
Learn more about how to use these properties to build dynamic cross-sell flows.
Customizable CLV report
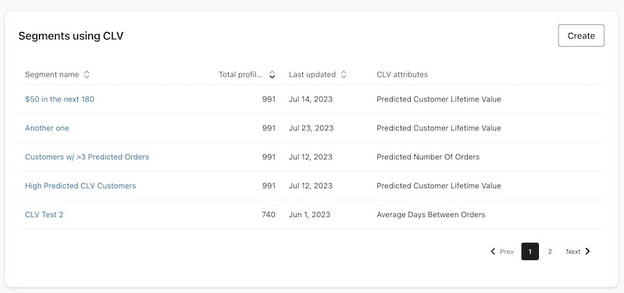
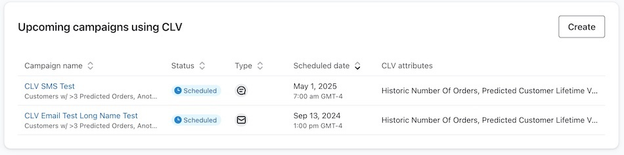
The customer lifetime value (CLV) report predicts your customers’ future purchases and spending based on their purchase history. The dashboard also shows the segments, campaigns, flows, and forms that use CLV attributes, helping you see where these predictions inform your marketing.
These insights provide opportunities for you to cross-sell and up-sell upcoming purchases, as well as how to best personalize the customer buying experience, including around key times of year and events that matter to certain customers. Examples of some of this report’s features are shown below.
Other benefits
Custom metrics
While custom metrics are available on all Klaviyo accounts, purchasing Personalization or Advanced KDP increases the number of custom metrics permitted on your account from 1 to 50.
The custom metrics feature in Klaviyo allows you to filter or combine existing metrics for reporting that better represents your business operations. Custom metrics do not change the original events.
By default, Klaviyo provides metrics that track your business’s performance and measure success (e.g., a Placed Order event). However, there may be instances where you need to create custom metrics to more accurately capture how your business runs. For example, your Placed Order events include recurring subscriptions by default, and you’d like to review only orders placed through your ecommerce website.
Learn how to configure custom metrics in Klaviyo.
Some examples of common use cases for custom metrics include:
Separating retail and ecommerce events (Shopify or other custom integrations)
With Shopify and some custom integrations, physical retail (POS) and ecommerce orders are tracked under the same metric (e.g., Shopify Placed Order).
To analyze online orders separately, you can set up a custom metric like the example below that excludes point of sale (POS) orders. This filters the orders included in the custom metric without changing the original Placed Order events.

Removing recurring subscription events with Shopify, WooCommerce, or BigCommerce
As noted above, standard Shopify integrations, WooCommerce, and BigCommerce will include subscriptions in Placed Order events automatically. This means that they are calculating both ecommerce and subscription orders together. In the example below, by using does not equal, you can isolate and review Placed Order metrics that do not include subscription orders.
