Getting started with the Catalog Insights dashboards
You will learn
Learn how to use Catalog Insights, including the Product Analysis and Category Analysis dashboards, to understand customer purchasing behaviors and craft targeted marketing to match. Review insights around how, what, and when products and categories in your catalog are driving orders and align your messaging at the right time in the customer journey.
Advanced KDP and Marketing Analytics are not included in Klaviyo’s standard marketing application, and a subscription is required to access the associated functionality. Head to our billing guide to learn about how to purchase these plans.
Strategically using Catalog Insights
Catalog Insights offers two dashboards: Product Analysis and Category Analysis.
Product Analysis gives you granular, product-level insight which is useful for precise flow timing, bundle recommendations, and next-product targeting. Category Analysis shows the same patterns rolled up to the category level, making it easier to spot broad trends, cross-category affinities, and strategic merchandising opportunities without getting lost in individual SKUs.
Used together, the dashboards give you a fuller picture of your catalog performance, helping you tailor marketing strategies that work at every level, from broad category trends to individual product recommendations. Here are some examples of how to put those insights into action:
- Adjust post-purchase flow timing
Set up a flow triggered off a purchase event and add a wait step based on insights from the Repeat purchase timing card for the relevant product or category. - Adjust post-purchase flow content
Set up a flow triggered off of a purchase event to promote a product or category recommendation from insights in the Products / Categories bought in the next order card. - Automate recommended bundles/co-purchases
Set up a flow triggered off an abandoned cart event with a reminder to purchase and a recommendation drawn from the Products / Categories bought in the same cart card. - Inform your merchandising strategy
Identify the best products or categories to promote together or in succession in campaigns, using the Products / Categories bought in the next order or Products / Categories bought in the same cart cards.
Before you begin
Setting up your dashboards
To get started with your dashboards, follow these steps:
- Ensure your integration is connected
Verify that your ecommerce integration is properly connected to Klaviyo. - Sync your catalog
Once you have configured your integration, make sure your product catalog is synced by reviewing the information in the Products page (in Klaviyo, click the Content dropdown on the left, then select Products). Review the Items tab to ensure all of your products are appearing properly as well as the Categories tab. Note that category data is sourced from the category fields in your product catalog as passed through your ecommerce integration (e.g. Shopify collections / smart collections / tags). - Map the Revenue metric to your Placed Order event
This is the metric used to populate your dashboard. You must ensure that your portfolio or account mapped metrics have Revenue mapped to your Placed Order event.- Using standard integrations: If you're using a standard ecommerce integration (e.g., Shopify, WooCommerce), Placed Order events are automatically ingested and include all required data.
- Using custom metrics or non-standard integrations: You can map Revenue to custom metrics or custom events. However, ensure that these events follow the same structure as Placed Order events or include the following parameters: product ID, order ID, price, and quantity. For more information on the recommended event structure, see the Placed Order event schema.
- Set up exclusions in the Settings page
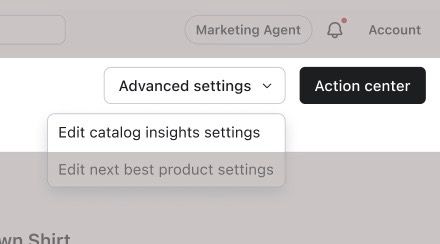
Once your dashboards are populated, navigate to Advanced Settings > Edit catalog insights settings to exclude specific categories or products from your dashboards. Learn more about configuring exclusions here.
After completing steps 1-3, it will take 48 hours for your report to be processed and generated. Additionally, if you edit a mapped metric or use a new custom metric, it may take up to 48 hours for this change to be reflected.
What data is included
- Product and category data from the last 2 years only.
- Only purchase events (e.g., no views, added to cart events, etc.).
- Single product or category views (i.e., replenishment or repeat purchases of the same product do not get matched up).
Navigating to Catalog Insights
If you are an Advanced KDP customer, navigate to Advanced KDP > Intelligence > Catalog insights. Alternatively, if you are a Marketing Analytics customer, navigate to Marketing Analytics > Catalog insights.
From the Catalog Insights section, switch between the Product Analysis and Category Analysis dashboards using the tabs at the top of the page.
Using the dashboards
Understanding your insights cards
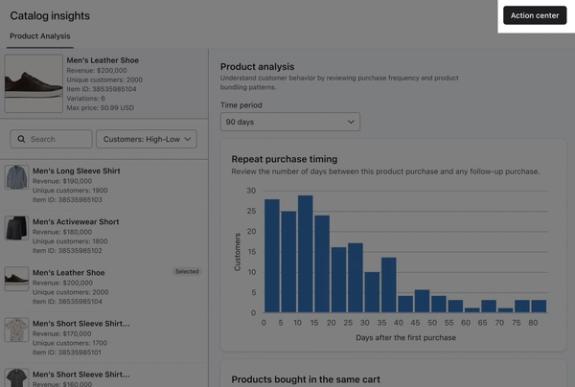
Select a product or category from the left-hand panel to populate the cards on the right. Use the Search field or sort by Revenue or Customers (high-to-low or low-to-high) to find what you're looking for. All cards update to reflect your selection.
The cards below work identically across both dashboards with the only difference being whether they reflect individual products or product categories.
Repeat purchase timing card
The Repeat purchase timing card visualizes the time between the purchase of a selected product or category and the customer's next order. This helps you understand purchasing behaviors tied to specific products or categories, so you can craft flows and campaigns relative to when customers are most likely to make a second purchase. You can also use this to identify products or categories with a shorter time between purchases and target those customers to encourage repeat shopping.
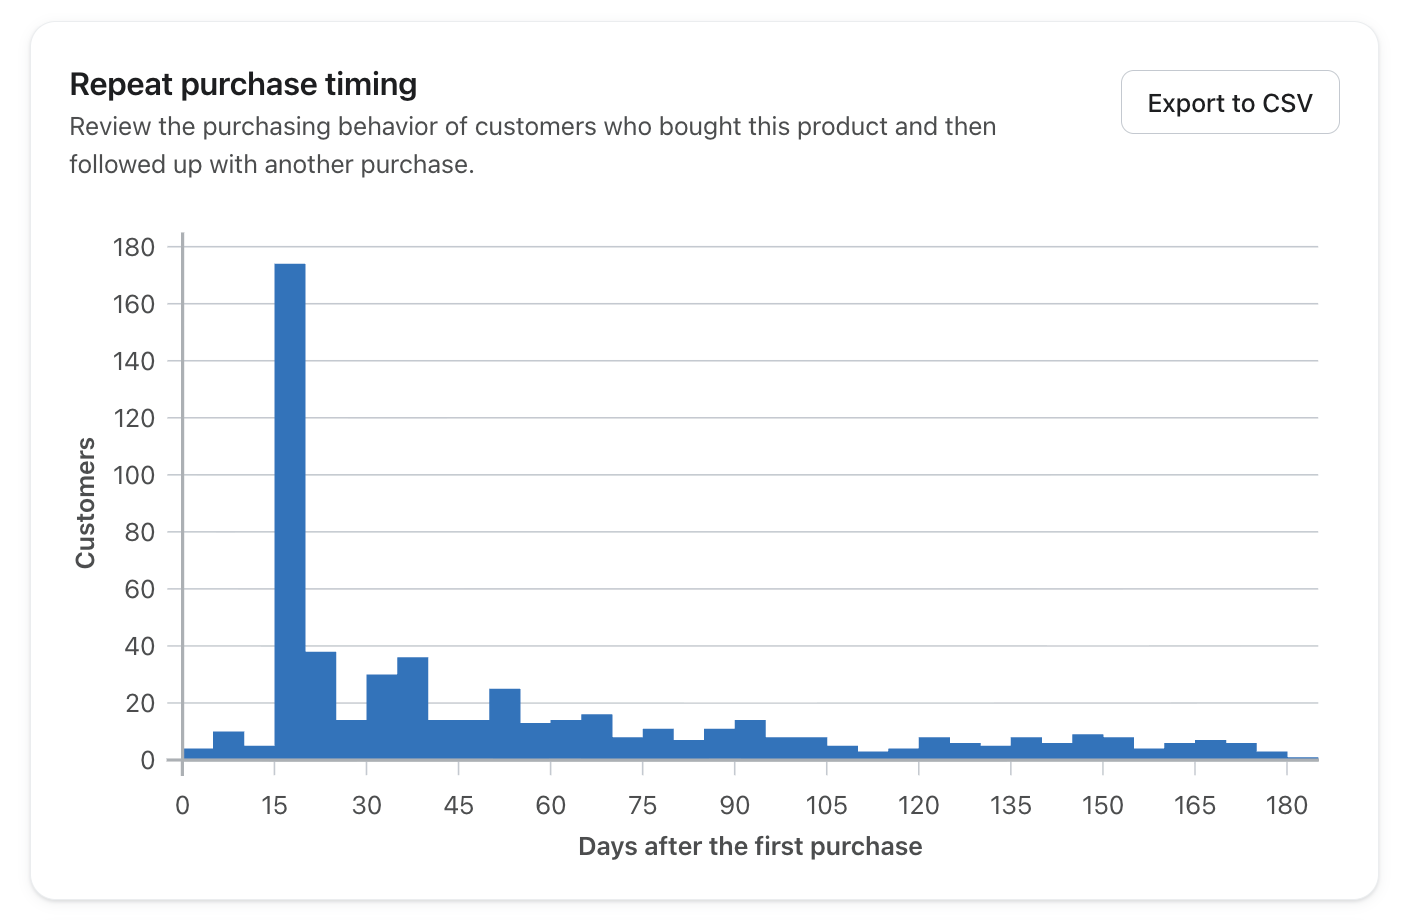
The x-axis of the chart represents the days between the first product order and the customer’s next purchase. Please note that there is a 90-day max view limit for this. The y-axis is the number of customers who placed a second order.
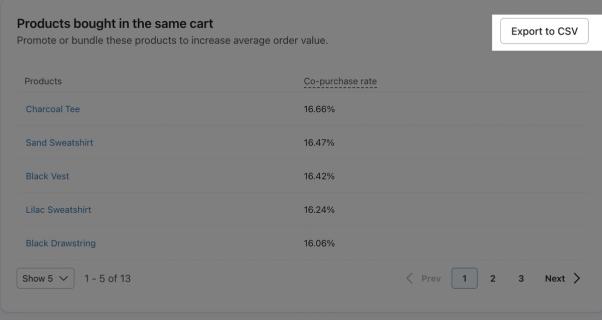
Bought in the same cart card
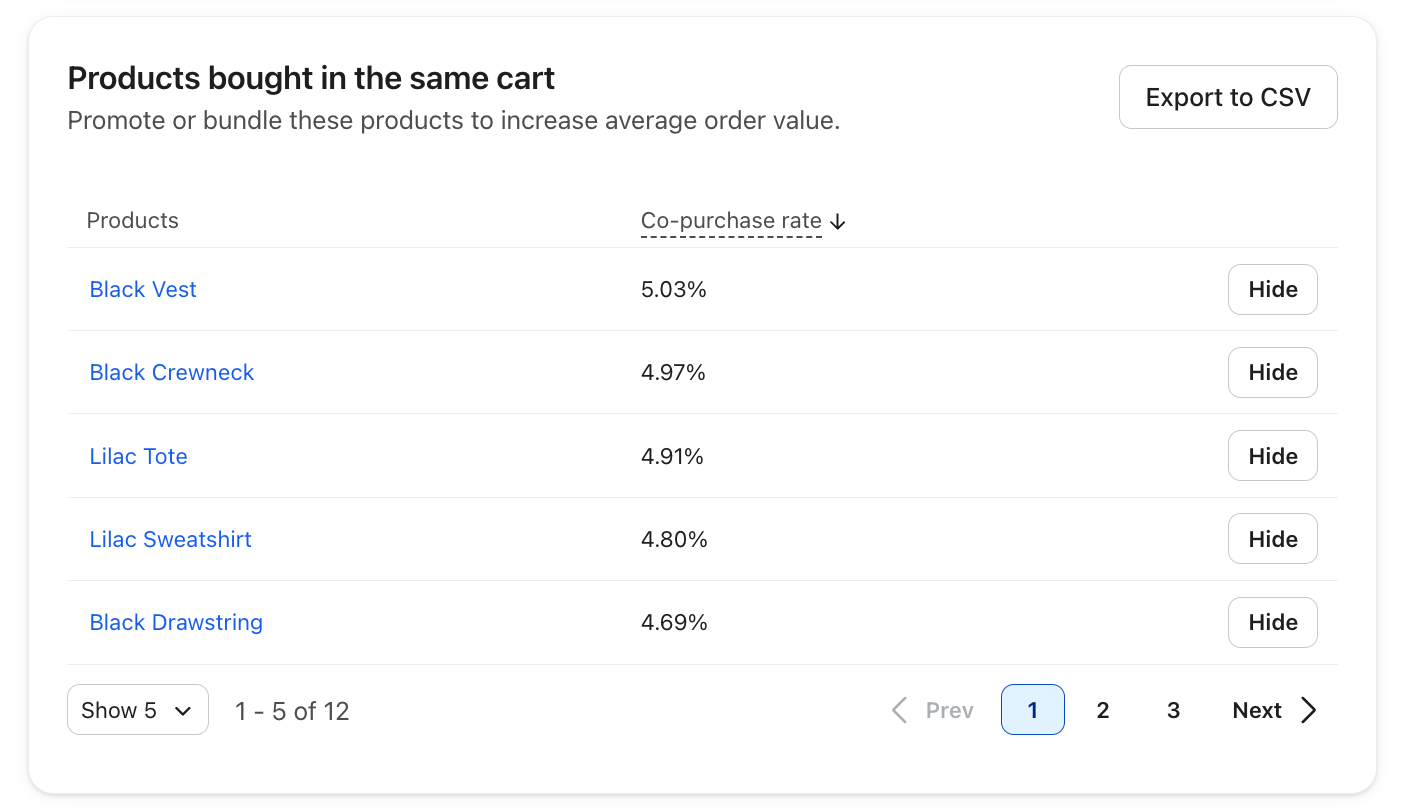
The Product bought in the same cart and Categories bought the same cart cards show a ranked list of products or categories purchased in the same transaction as your selection, with a co-purchase rate showing the percentage of orders that included both. Use these insights to identify bundle opportunities, inform cross-sell offers promoting complementary products in a post-purchase flow or targeting customers based on category affinities in a campaign, or even offer discounts on certain secondary items at checkout.
Bought in the next order card
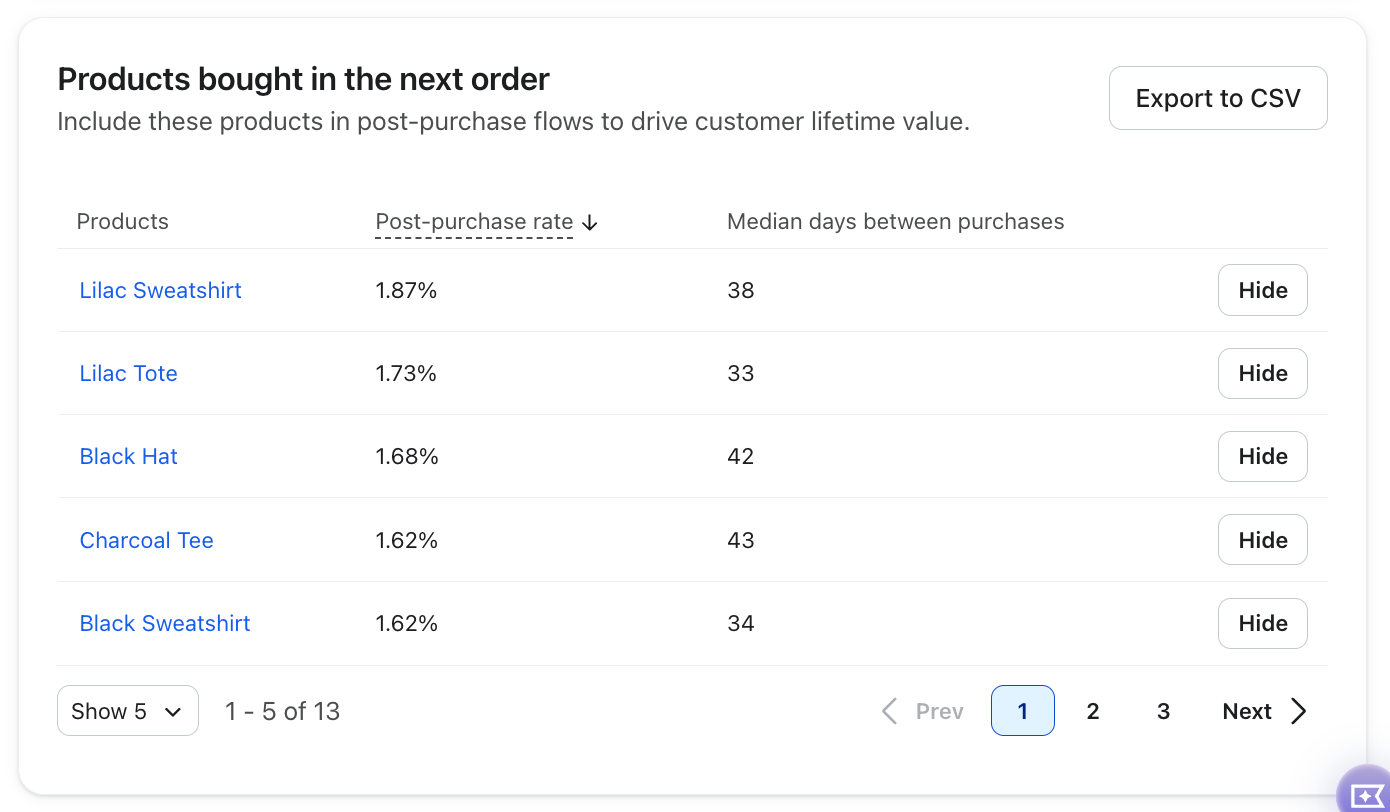
The Products bought in the next order and Categories bought in the next order cards show a ranked list of products or categories purchased in a subsequent order, with a post-purchase rate and median days between orders. Use these insights to personalize follow-up flows and campaigns with the most likely next product or category purchase, helping you guide customers naturally from one purchase to the next.
Showing and hiding rows
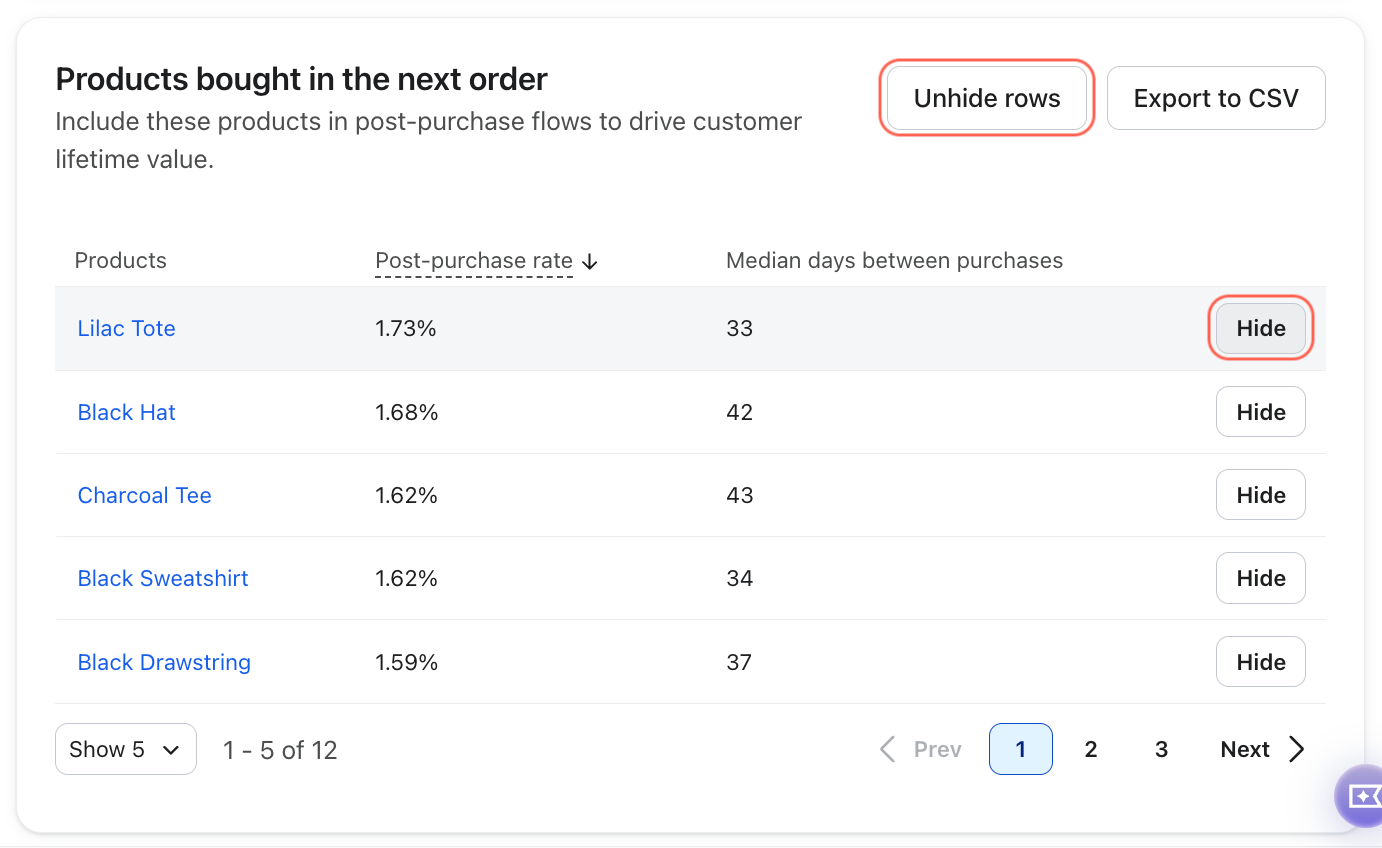
Each card's table includes Show / Hide functionality to help you focus on what's relevant. Click Hide on any row to remove it from view without excluding it from reporting or predicted properties. To bring hidden rows back, click Unhide rows. This is useful for temporarily clearing out products or categories that aren't relevant to your business right now, while keeping their data intact.
Export to CSV
You can also export data from these cards to a CSV file. Select the Export to a CSV button on the card you'd like to export data for. This will download a CSV with the information on the card.
Action center
The action center provides you with recommendations and key steps you should take to improve your performance and get more value from catalog insights.
To access the action center, select the Action center button on the Catalog Insights page.
You’ll see key actions that you should take, in the order they should be completed. You can complete actions like building a flow directly from the action center
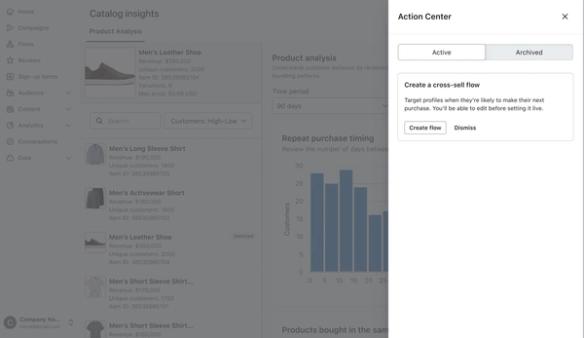
To hide a recommendation in the action center, select Dismiss. This will cause the item to go into the Archived tab.
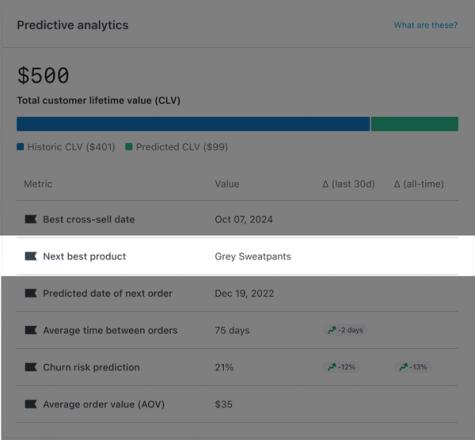
Predictive profile properties
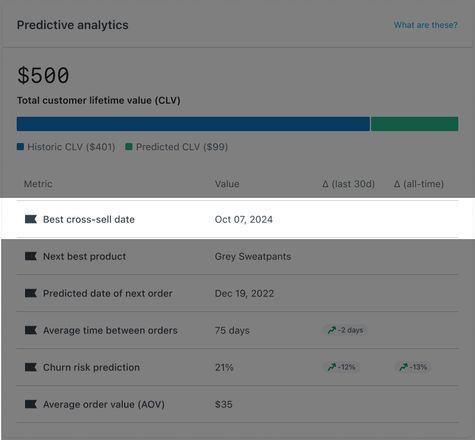
Catalog Insights generates two predictive properties on customer profiles, visible under Predictive analytics. These are derived from patterns across your entire catalog to give you the most accurate picture of each customer's buying behavior. Rather than manually interpreting the data, these properties allow you to take action on your catalog insights seamlessly, making it easy to build targeted segments, trigger timely flows, and deliver personalized recommendations without additional analysis.
Best cross-sell date
The Best cross-sell date property indicates the optimal time to attempt a cross-sell for a profile, based on the purchasing patterns of customers who bought the same item. This is a dynamic property that updates daily when a profile makes a purchase.
If there is not enough data to make a recommendation based on a product's subsequent purchases, Klaviyo will identify the best cross-sell date based on your entire product catalog.
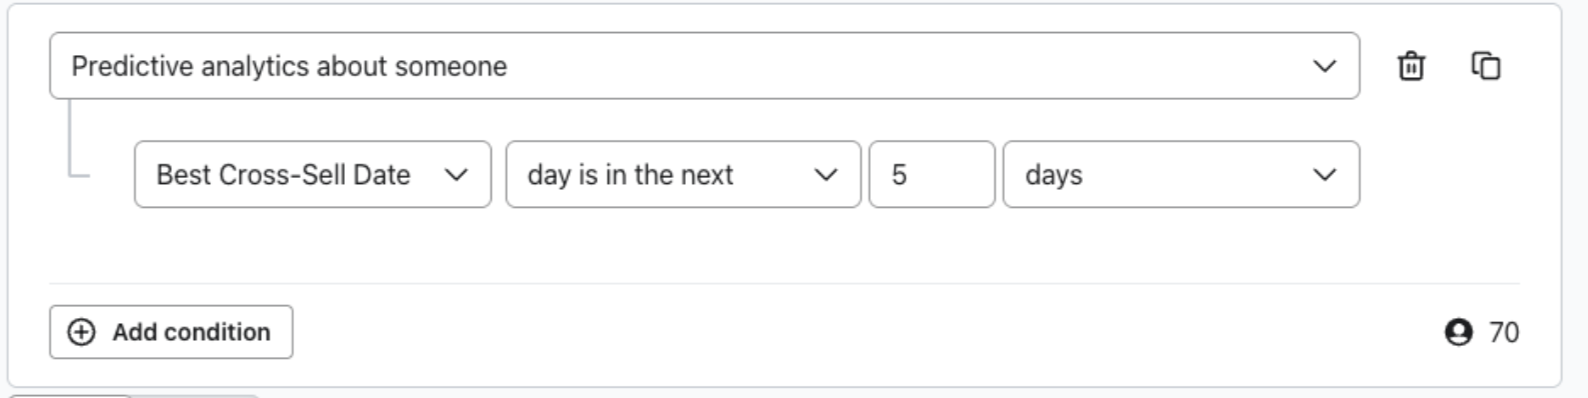
Build a segment using best cross-sell date
You can also use the best cross-sell date in segments to group customers based on when the best time to attempt cross-selling to them is. For example, you can send a campaign with a coupon code to a group of customers with an upcoming best cross-sell date to further encourage them to purchase.
To create a segment based on the best cross-sell date, select Best cross-sell date under Predictive analytics about someone in the segment builder.
Best cross-sell date vs. Expected date of next order
Klaviyo’s base marketing application includes an Expected date of next order property as part of its predictive analytics. There are some key differences between the Best cross-sell date property and the Expected date of next order property. The key difference is that Best cross-sell date is based on product-level purchase data, taking into consideration multiple items in someone's last order and identifying sequential patterns. Expected date of next order does not take product-level data into account, which has a strong impact on repeat purchase timing.
Learn how to build a flow using the best cross-sell date property.
Next best product
The Next best product property determines the next best product for a profile based on their most recent purchase. As a profile continues to place orders, this property updates automatically. The following are excluded from the model:
- The first 48 hours of repeat purchase data for a profile. The first 48 hours after a purchase generally has the highest volume of returns and exchanges, and can skew results.
- Unpublished products.
- Out of stock products.
- Refunded orders.
- Cancelled orders.
- Any products and products within categories excluded in the Catalog Insights settings page.
If a profile does not have a recommended Next best product because they have never made a purchase, Klaviyo will display your most popular product based on the number of units sold in its place.
Using next best product in templates
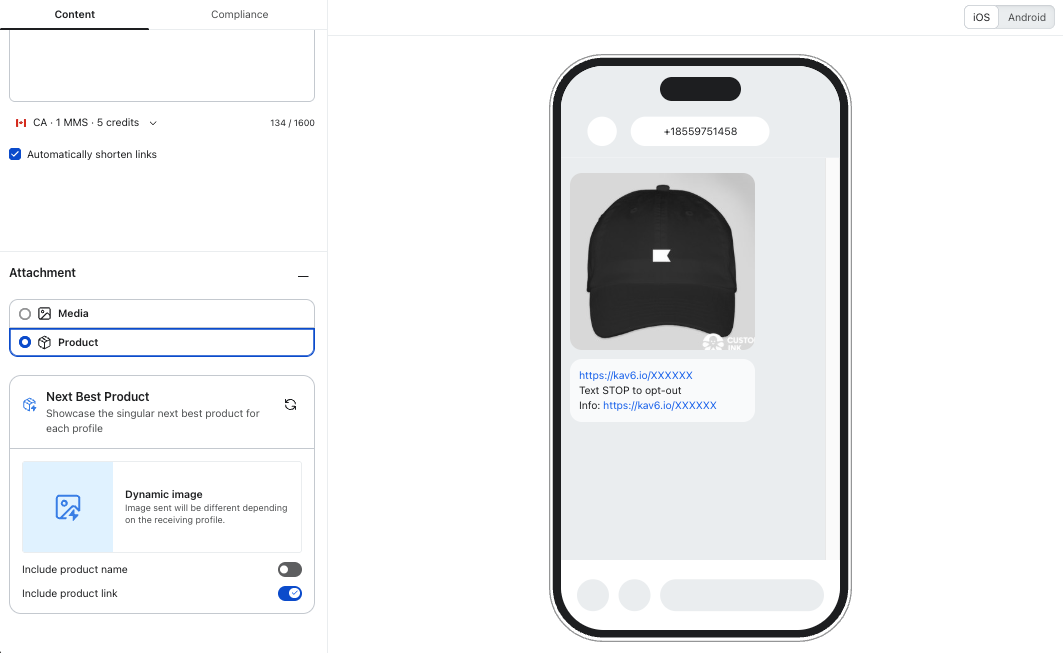
To make your marketing sends more effective, you can leverage the Next best product profile property. You can take advantage of this profile property through the Next best product block. This product block will show each recipient the next best product they are most likely to purchase based on their last purchase.
To use the next best product, add the Next best product block to your email templates or to RCS, SMS, or Whatsapp messages.
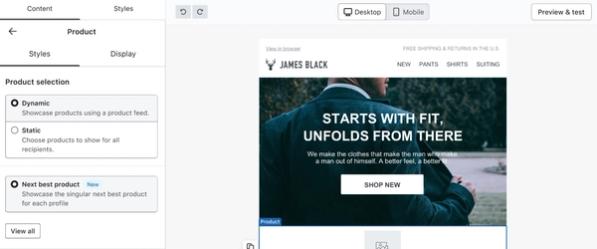
Additionally, make sure to configure the appearance of the block to meet your design requirements.
Learn how to style product blocks in the template editor.
Catalog exclusions
Default exclusions
Refunded and cancelled orders are excluded from your dashboards automatically.
Partially refunded orders are only supported with catalog exclusions if a separate event is sent for these.
However, there is some integration-specific behavior to note:
- SFCC integrations
Salesforce commerce cloud (SFCC) integrations do not support the exclusion of refunded and cancelled orders. - PrestaShop integrations
Only fulled refunded orders are supported with catalog exclusions on PrestaShop integrations. A partially refunded order will not be excluded. - Custom integrations
If you have a custom integration, you must have the appropriate metric mapping set up for the cancelled and refunded order metrics.
Product and category exclusions
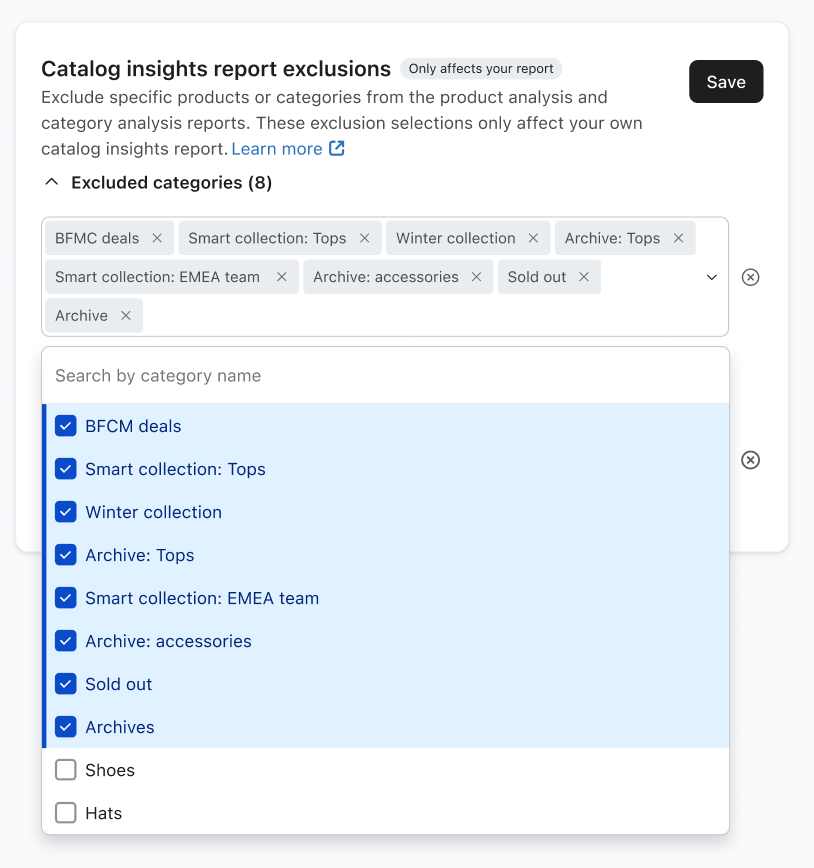
You can also set specific products and categories to be excluded from your product and category analysis reports inside catalog insights. These updates will only apply to your own report views.
Your next best product (NBP) recommendations are controlled separately. Learn more about updating your account-wide NBP settings here.
Updating category and product exclusions
- Navigate to Advanced Settings > Edit catalog insights settings. From here you will be taken to the Catalog Insights Settings tab.
- Click on the collapsible sections for either categories or products.
- From here, select or search for any categories or products you wish to exclude. from the categories or products on the product and category analysis reports.
- Select Save to immediately apply your changes to your reports.
Troubleshooting
If you encounter issues with your Catalog Insights reports, review the common error messages and solutions below:
|
|
|
|---|---|---|
Your report is being created and could take up to 48 hours to complete. Check back soon.
| You will see this message if you have recently done any of the following:
|
After signing up for Marketing Analytics, syncing a new catalog, or mapping your Revenue metric, it may take up to 48 hours to process all of your data and create your report. This is normal and no action is required.
If it has been more than 48 hours and you are still seeing this message, please contact
|
There are issues connecting to your product catalog
| Your product catalog is not connected to Klaviyo or there is an issue with the connection. | Verify that your integration is properly connected and that your catalog has been synced. Review |
Add a Revenue metric to view this report
| Your Revenue metric has not been mapped to your | Follow the instructions in |
There are issues connecting to your product catalog and your revenue metric is not properly mapped
| This error indicates multiple configuration issues:
| Address both issues by following the setup steps:
|
Metric data from your ecommerce integration is missing or not set up properly
| This error typically occurs when:
|
First, verify that the product IDs in your
If the IDs match and you're still seeing this error, contact
|
Your report is missing revenue data.
OR
Your report is missing revenue and may include refunded or canceled orders.
| This error occurs if you have have mapped your Revenue metric but your revenue is returning 0 for all products. | Please contact |
Your report currently includes refunded and / or canceled orders. | You will see this message if your report currently includes refunded and / or canceled orders in the dashboard which will inflate your metrics. | Adjust your |
If you continue to see these error messages after completing the steps above, please contact support for assistance.
Additional resources
Getting started with Advanced KDP
How to add a product block to an email