Understanding the Klaviyo home dashboard
You will learn
Learn how to use the Klaviyo Home dashboard to analyze how your email, SMS, or push marketing channels are contributing to your conversion goals. You can also review data insights from your recent campaigns and top performing flows.
About the Home dashboard
Your Home tab in Klaviyo is customized to your brand. Depending on your setup, you may see personalized recommendations and next steps for your account, a Pick up where you left off section with links to recent forms, flows, and campaigns you’ve worked on, and more.
All accounts have access to these core sections of the Home dashboard:
- Business performance summary
An overview of your marketing performance, including comparisons to your performance from a previous period. - Top-performing flows
Up to 6 of your top-performing flows, based on the conversion metric you select. - Recent campaigns
A summary of your recent campaigns’ performance.
All of these sections use the conversion metric and time period you select in the Conversion metric section (discussed below).
About the conversion metric
The conversion metric selected on the Home dashboard is used across your Klaviyo account. This metric represents the conversion activity you’re trying to achieve through your marketing; for most Klaviyo users, Placed order is the best conversion metric.
Learn more about conversion tracking in Klaviyo.
How to adjust the conversion metric and time frame
- Navigate to the Home tab.
- Under Conversion metric, select a conversion metric from the dropdown.

- Select a date range and comparison period in the Time period selector.
You can select a time range of up to 180 days. Dates are inclusive; if today is September 7 and you choose Last 7 days, your metrics will reflect activity from September 1 through September 7, inclusive of the current date.
- Every conversion metric throughout Klaviyo will automatically update to reflect your selection. However, the selected time period applies only to the Home tab.
If the conversion metric you choose has monetary value (e.g., Placed Order), you will see revenue in the analytics sections of your Home dashboard. If you do not choose a conversion metric with an associated monetary value (e.g., Active on site), you will instead see the total number of conversions.
Reviewing your alerts
The alerts section at the top of the Home dashboard provides an easy way to review important information, potential issues with your account, and how to resolve these items quickly. By clicking View More, you can see all of your current alerts.
Since alerts depend on potential billing or account problems, you may not see the alerts section if you are not experiencing these issues or if your user role does not provide access to that area of Klaviyo.
In this area, you may see notifications related to billing and payments, or issues with specific flows or campaigns. For example, these messages could include:
- Failed payments
- Flow metric anomalies; e.g., if a flow’s triggering metric has seen a decrease in its volume of events, compared to historic performance
- Message delivery; e.g., if a specific message in a flow (email, SMS, or push notification) sees a sudden decrease in its volume of received events, compared to historic performance
Using the business performance summary card
The business performance summary card enables you to see:
- Your total revenue or conversion rates
- The conversions or revenue by specific channel (i.e., email, SMS, or push notifications)
- How these messages were sent (i.e., via a flow or campaign)
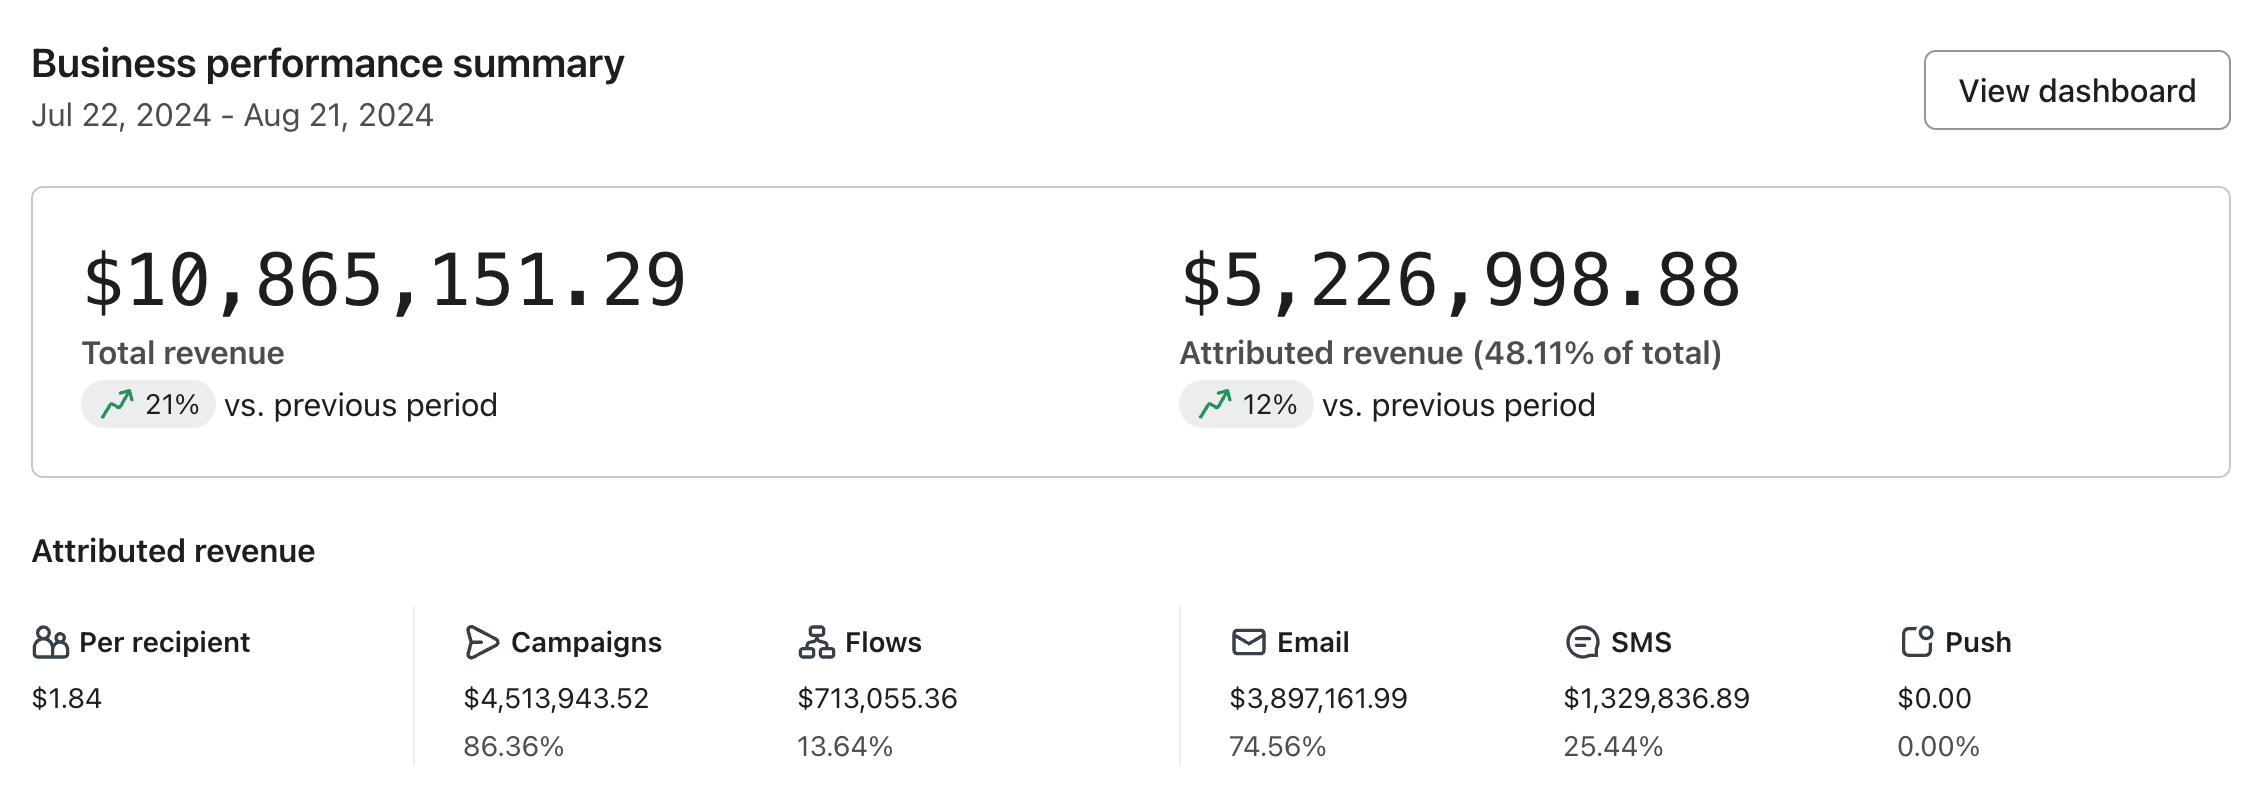
Total revenue vs. attributed revenue
At the top of the business performance summary card, your revenue is broken into 2 sections:
- Total revenue
All revenue from the selected period. - Attributed revenue
Revenue from the selected period that can be attributed to your marketing efforts through Klaviyo (i.e., your email, SMS, and push messages).
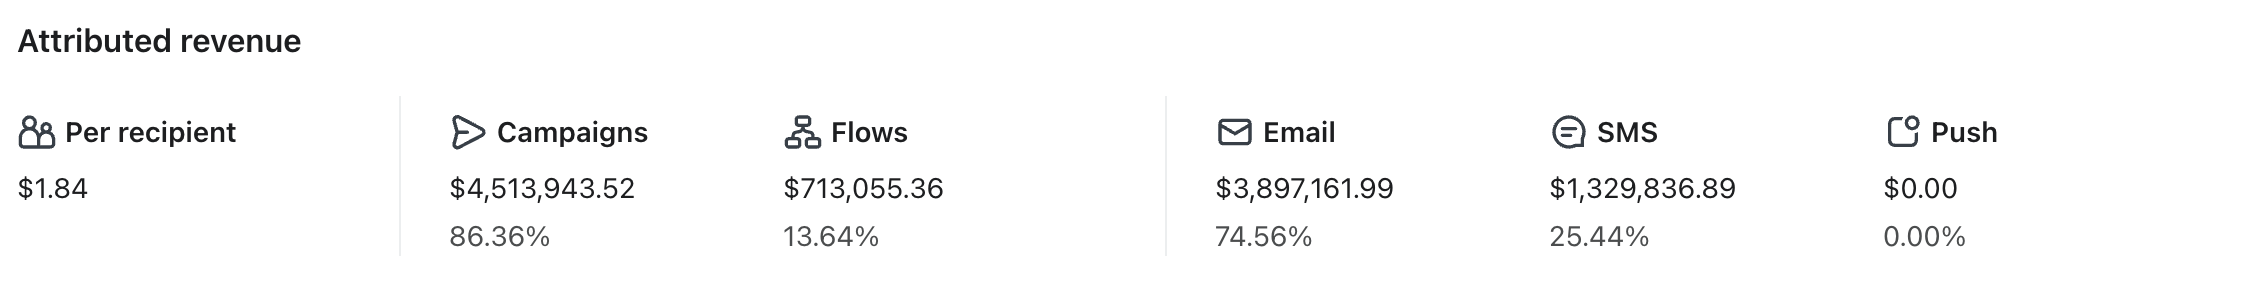
Reviewing your Klaviyo attributed revenue or conversions breakdown
At the bottom of your business performance summary card, you will see a breakout by channel of either revenue or conversions, depending on whether or not the selected conversion metric relates to monetary value.
If your metric is associated with monetary value (e.g., Placed order), you will see the Attributed revenue section. This section provides a breakout of revenue totals and where this revenue came from (i.e., flows, campaigns, email, push notifications, or SMS).
If you did not choose a conversion metric with an associated monetary value (e.g., Active on site), you will see the Attributed conversions section instead, with a count of conversions attributed to each category.
Viewing all analytics data
To see a complete view of your data, click View dashboard in the top-right corner of the business performance summary card.

Here, you’ll find a comprehensive view of your revenue and conversions related to campaigns, flows, and forms as well as information about deliverability and industry benchmarks. Read more in our guide about getting started with analytics dashboards.
Using the Top performing flows card
The Top performing flows card lists flows by descending order of conversions or revenue. In other words, your most successful flow will be at the top of the list. Only flows with at least 1 message set to Manual or Live mode will appear in this card.
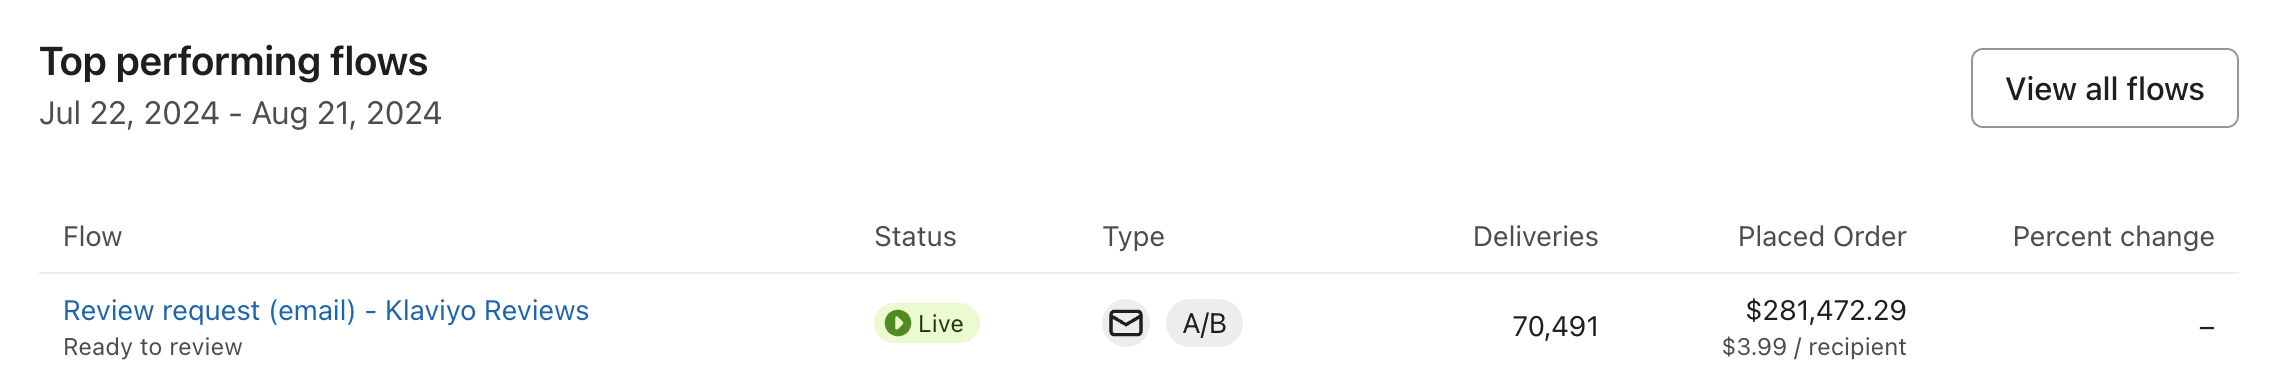
The columns in the card represent the following:
- Flow
The flow name and trigger. - Status
Live or Manual, depending on what status the flow is currently set to. - Type
Icons representing the types of messages that the flow contains:- Email
- Email
- SMS
- Push notification

- A/B test

- Deliveries
The total number of successfully delivered flow messages in the selected time period. - Conversion metric
Your selected conversion metric, with either the monetary value of those conversions or the number of individual conversions, depending on whether the metric has associated revenue or not. - Percentage change
Whether conversions have increased, decreased, or stayed the same compared to the previous period.
See analytics for all your flows by clicking the View all flows button in the top-right corner of the card.
Using the Recent campaigns card
The Recent campaigns card shows all the email, SMS, or push notification campaigns successfully sent within the timeframe you chose, with the most recently sent campaign at the top of the list.
Campaigns that did not successfully send, are currently in draft mode, or are in the process of being sent do not appear here.
If your conversion metric is associated with monetary value (e.g., Placed order), this summary includes a Revenue column. If your conversion metric does not have associated monetary value (e.g., Active on site), the summary includes a conversion count instead.
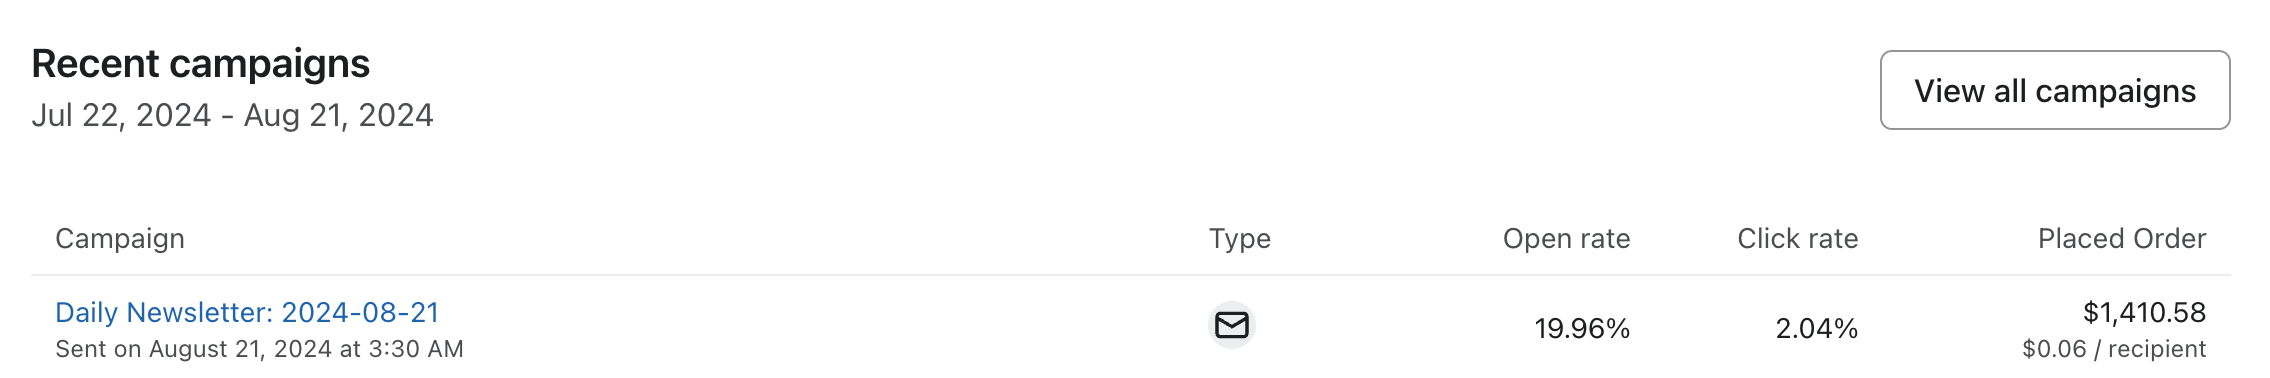
The columns in the card represent the following:
- Campaign
The name of the campaign and the date and time when it was sent. - Type
Icons representing the types of messages that the campaign contains:- Email
- Email
- SMS
- Push notification
- A/B test
- Open rate
The open rate for each email and push campaign. The open rate includes the unique number of opened messages divided by the number of total received messages. (Opens are not tracked for SMS messages, so this column appears blank.) - Click rate
The unique number of clicks for an email or SMS campaign, divided by the total number of received messages. (Clicks are not tracked for push notifications, so this column appears blank.) - Conversion metric
Your selected conversion metric, with either the monetary value of those conversions or the number of individual conversions, depending on whether your metric has associated revenue or not.
See analytics for all your campaigns by clicking the View all campaigns button in the top-right corner of the card.