List growth reporting reference
You will learn
Learn how to access and analyze your list growth report. For every list in Klaviyo, you can access a growth report that captures data regarding your list's changes over time. Use this tool to monitor business trends and expand your business.
Learn about segment growth reporting in our article on getting started with the segment growth report.
Before you begin
The data source for the list growth report has changed from July 1st, 2025. After this date, data is calculated more accurately, allowing you to see daily list growth data instead of just weekly and monthly.
You may see a change in your report data based on this update. When viewing your list growth report, you can view the specific change when hovering over report data.
Access your list growth report
To access your list growth report,
- Head to Audience > Lists & segments.
- Navigate into any list.
- Click List growth.

Analyze the sources of your list changes
Klaviyo assigns all list subscribers a $source property that reflects how the contact was added to your list. When someone unsubscribes, we will also track how they unsubscribed.
While it's possible to customize a given form's $source value, Klaviyo will otherwise track and use the following default values:
Default subscribe source values
- Unknown
Subscriber source is not identifiable. - Back in stock
Subscriber added via subscribing for back-in-stock notifications. - Subscribe page
Subscriber added via a subscribe page. - Manually initiated
Subscriber added via quick add or uploaded from a CSV file. - Integration
Subscriber added via opting in through an integration. - API
Subscriber added to a list via the Klaviyo API (i.e., subscribe profiles endpoint). - Transferred membership
Reflected when 2 profiles are merged, if the non-surviving profile was in the list before the merge. - Merged profile
Reflected when 2 profiles are merged, if both the non-surviving profile and the surviving profile were in the list before the merge. - Embedded form
Subscriber signed up using an embed form. - Flyout
Subscriber signed up using a flyout form. - Modal
Subscriber signed up using a popup form.
Default unsubscribe source values
- Unknown
Subscriber source is not identifiable. - Manually initiated (formerly Klaviyo UI)
Subscriber manually cleaned or removed from the list. This can include a variety of reasons including deletions, bot suppressions, or someone selecting Remove suppressed profiles in the list. - Subscribe page
Subscriber unsubscribed via an unsubscribe page. - One-click unsubscribe
Subscriber unsubscribed via one-click unsubscribe. - Integration
Subscriber unsubscribed via opting out through an integration. - Hard bounce
Subscriber’s email address hard bounced. - Spam complaint
Recipient marked your email as spam. - Invalid email
Recipient email address was not a valid address. - API
Recipient unsubscribed from a list via the Klaviyo API (i.e., unsubscribe profiles endpoint). - Transferred membership
Reflected when 2 profiles are merged, if the non-surviving profile was in the list before the merge.
If someone unsubscribes from a flow or campaign sent to a segment, they become suppressed in your Klaviyo account rather than unsubscribing from the list as a whole. Learn more about removing suppressed profiles.
Customize a form's sign-up source
If you're using a legacy form and want to customize the $source property, you can do this by making a small adjustment in your form's code.
List growth graphs
The total members and net membership change graphs provide insights into the health of your lists and net changes over time.
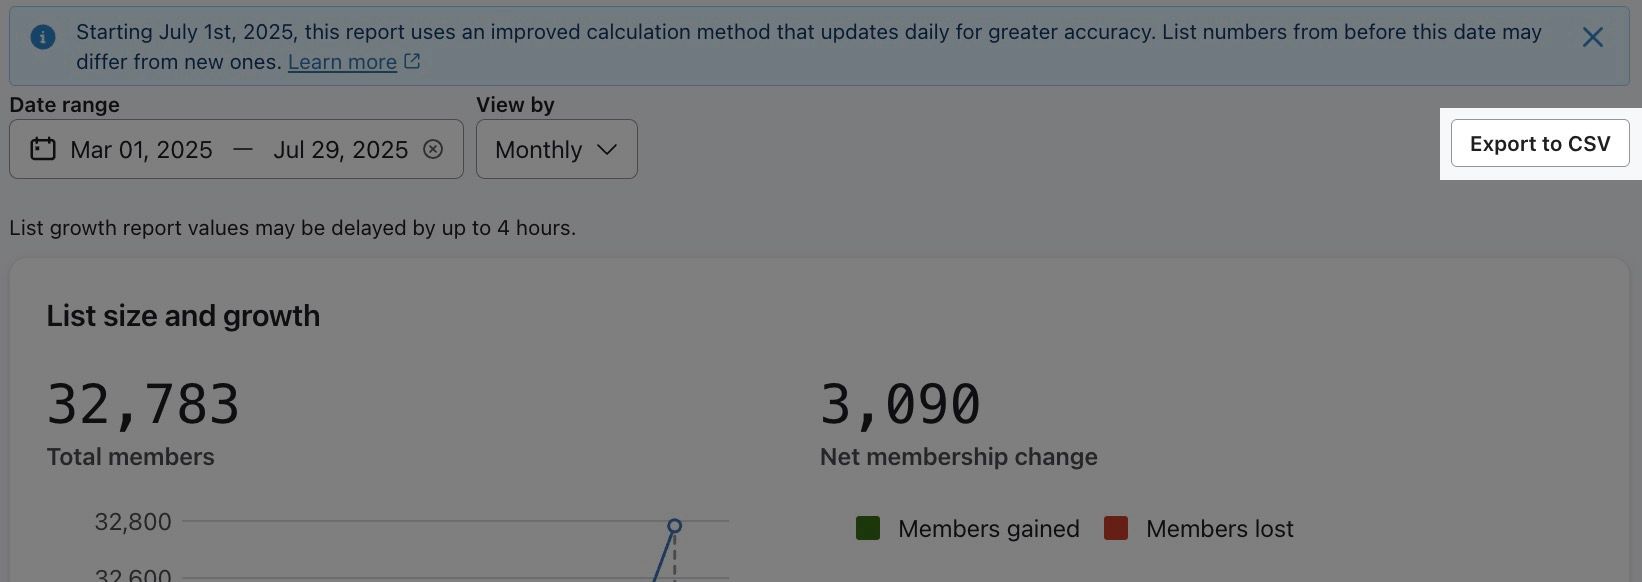
Beginning July 1st, 2025, this report uses an improved calculation method that updates daily for greater accuracy.
The dotted line on the list growth graphs represents the first full period (i.e., based on your View by selection) containing only data from after the cutover. If you hover over this dotted line, you can see how many profiles the calculation improved by. Note that the dotted line will only appear if July 1st, 2025 is included in the time period being analyzed.
Total members graph
The total members graph tracks your list changes over a period. The cumulative number of subscribers in this particular period will be captured in the top number. Note that if you change your date range, this number will adjust to show the total number of subscribers in that period.
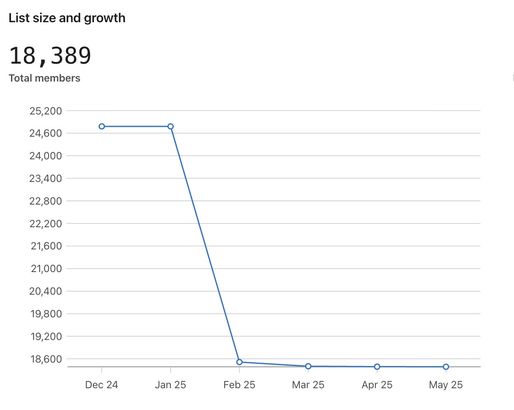
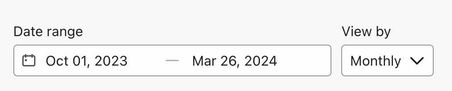
You can adjust the time frame at the top of the report via the Date range picker and visualize your data either by month, week, or day by using the View by dropdown. Note that the option to view the report by day is only available for data from July 1st, 2025.
On the weekly view, data is displayed from Monday to Sunday.
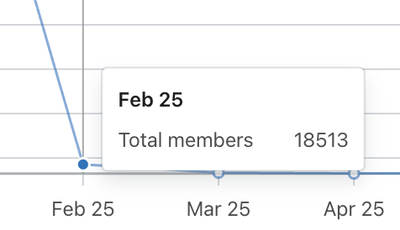
Additionally, by hovering over a point on the line graph, a popup will appear that provides the list size count for that point in time.
The list growth report can take up to 4 hours to update with new data and membership changes.
Net membership graph
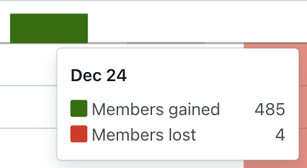
The net membership graph shows both positive (i.e., green) and negative (i.e., red) list size trends over time. The bars help to visualize the members lost and gained during a particular period. The top number will show the cumulative number of members gained or lost during this particular period. Note that if you change your date range, this number will adjust to show the number of losses or gains in that period.
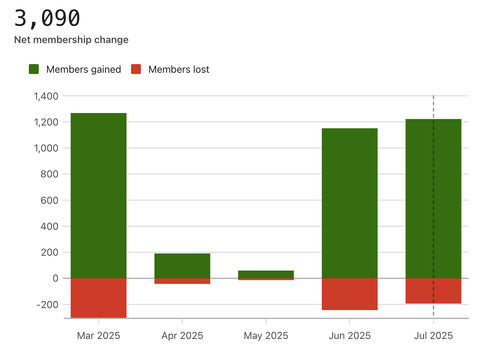
Additionally, by hovering over a bar in the graph a popup will appear that provides the amount of members gained and lost during that particular point in time.
Subscriber sources table
The table breaks down the number of subscribers and how they were added to your list (i.e., the source) per month or week.
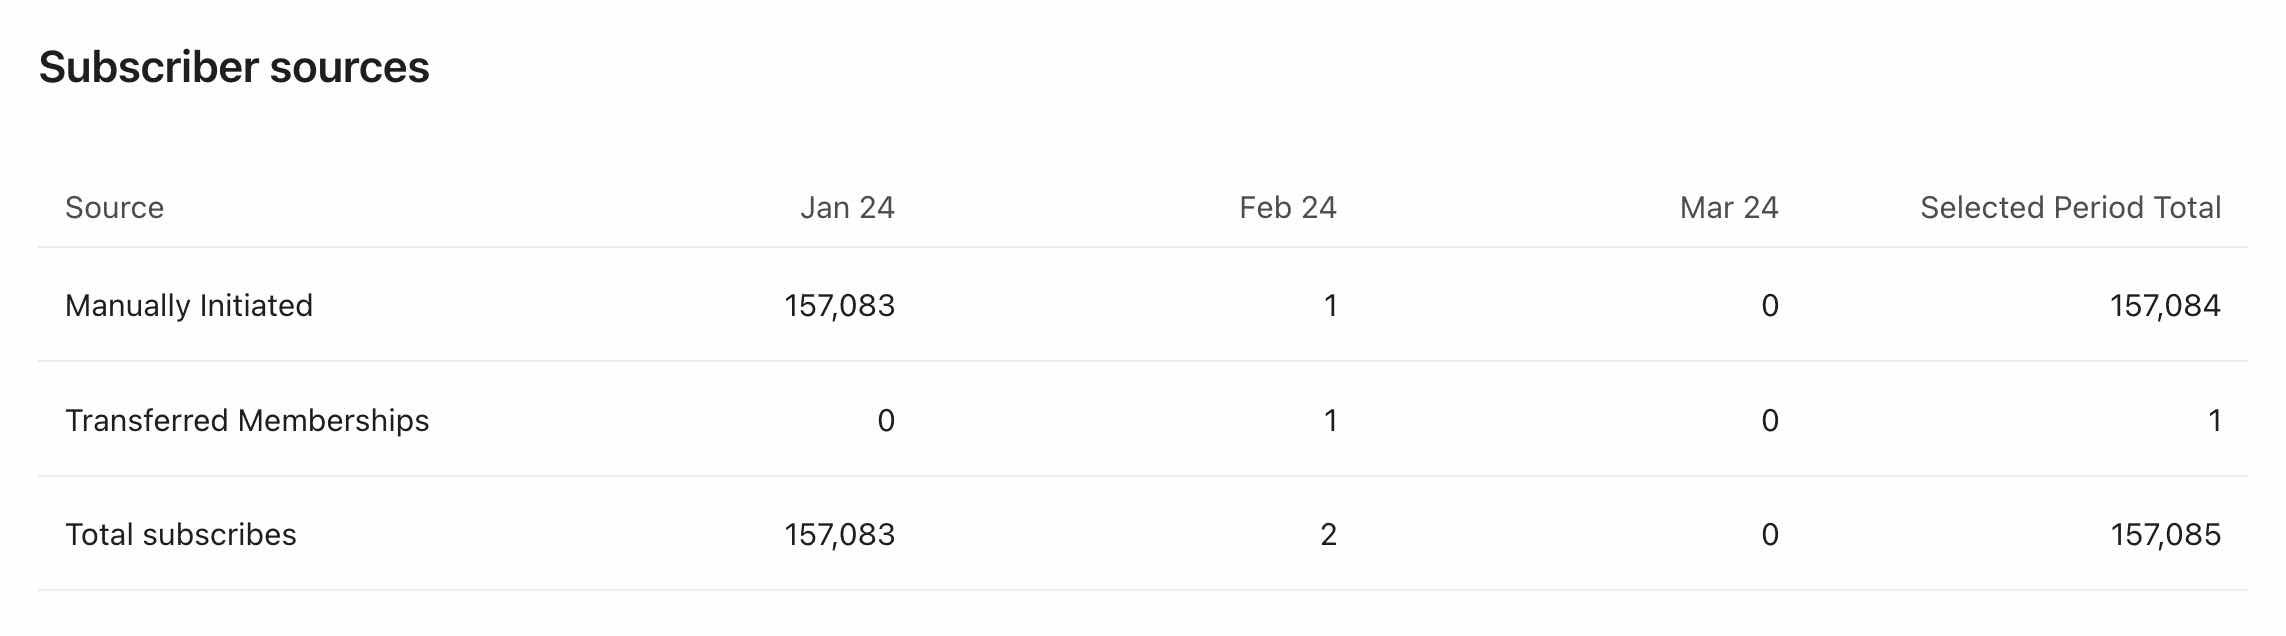
The totals section on the far right of the table will span the entire date range. However, the rest of the table will only show up to the 6 most recent time intervals from your date range. It will not show all time intervals.
When you update the Date range or View by on the list growth report, the table will also update.
Export report data
You can also export your list growth report data. Select the Export to CSV button at the top of the report.
The export will include the following columns:
- Time period
The time period broken down by your selected view. - Source
The source of the list additions. - Is subscribed
Whether the profile was subscribed through the source (i.e., true) or unsubscribed (i.e., false). - Count
The count of list additions or removals from the report during the time period.
Additional resources
- Understanding sign-up form analytics
Learn how to analyze your sign-up forms' performance so you can iterate and optimize based on knowledge of areas you excel in and areas where you can improve. This guide will help you gain a better understanding of your sign-up form analytics and each of the available reporting pages (i.e., Overview tab and A/B test results tab).
- Understanding available campaign analytics
Learn how to use Klaviyo's campaign reporting to gather insights on how your messages are performing and what happens after someone opens or clicks. Use these campaign analytics to dig deeper into website activity, checkouts started, and revenue that is directly attributabed to each message.
- Understanding flow analytics
Learn how to review the performance of your Klaviyo flow messages, including open, click, and conversion rates.