Understanding sign-up form analytics
You will learn
Learn how to analyze your sign-up forms' performance so you can iterate and optimize based on knowledge of areas you excel in and areas where you can improve. This guide will help you gain a better understanding of your sign-up form analytics and each of the available reporting pages (i.e., Overview tab and A/B test results tab).
You can measure performance for sign-up forms at the individual level, or compare data between multiple sign-up forms. In both cases, the metrics shown take into account tracked and untracked visitors, so you can get a holistic sense of your performance.
Before you begin
On the Sign-up forms tab, you will see a list of all the forms in your account and their key details, including:
- Form name with the list the form submits to beneath it
- Form type
- Status
- Submitted form events from the last 30 days (defined below)
- Perfomance
- Form submit rate from the last 30 days (defined below)
- Total revenue from the last 30 days (defined below)
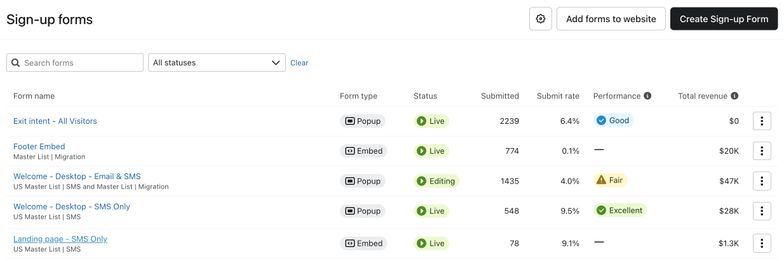
Take note of the benchmark status icon under Performance, which enables you to quickly contextualize how each form is performing (i.e., Poor, Fair, Good, or Excellent), so you can identify underperforming forms and know where to focus your improvement efforts. This status is calculated using the submit rate for a form compared to peer benchmark data for the last 3 months.
This icon will appear next to popup forms only, as benchmarks data is not currently available for flyout, full page, or embed forms.
Analyze an individual sign-up form's performance
To analyze the performance of a specific sign-up form:
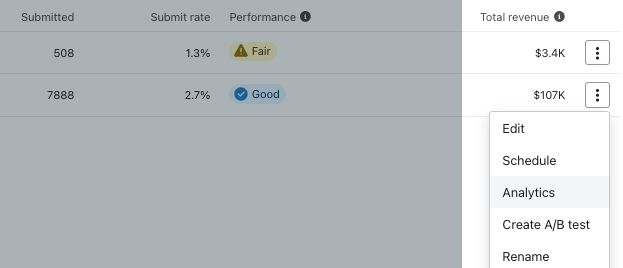
- Select Sign-up forms in Klaviyo's main navigation.
- Select the 3 dots > Analytics next to the individual sign-up form that you would like to analyze the performance of. Note that a form must have some data collected for analytics to be available.
- From here, you can toggle between the Overview tab and the A/B test results tab (if applicable) to get a comprehensive view of how your form is performing.
The following sections of this guide will detail each tab's information in the order it appears on the page.
Overview tab
Effecting April 1, 2025, Klaviyo implemented an improved method for filtering out a bot and crawler activity from form analytics. This update enhances the accuracy of form metric counts by eliminating artificial activity. As a result, you may notice a decrease in the number of Viewed form events accompanied by a higher Submit rate due to the removal of non-human interactions.
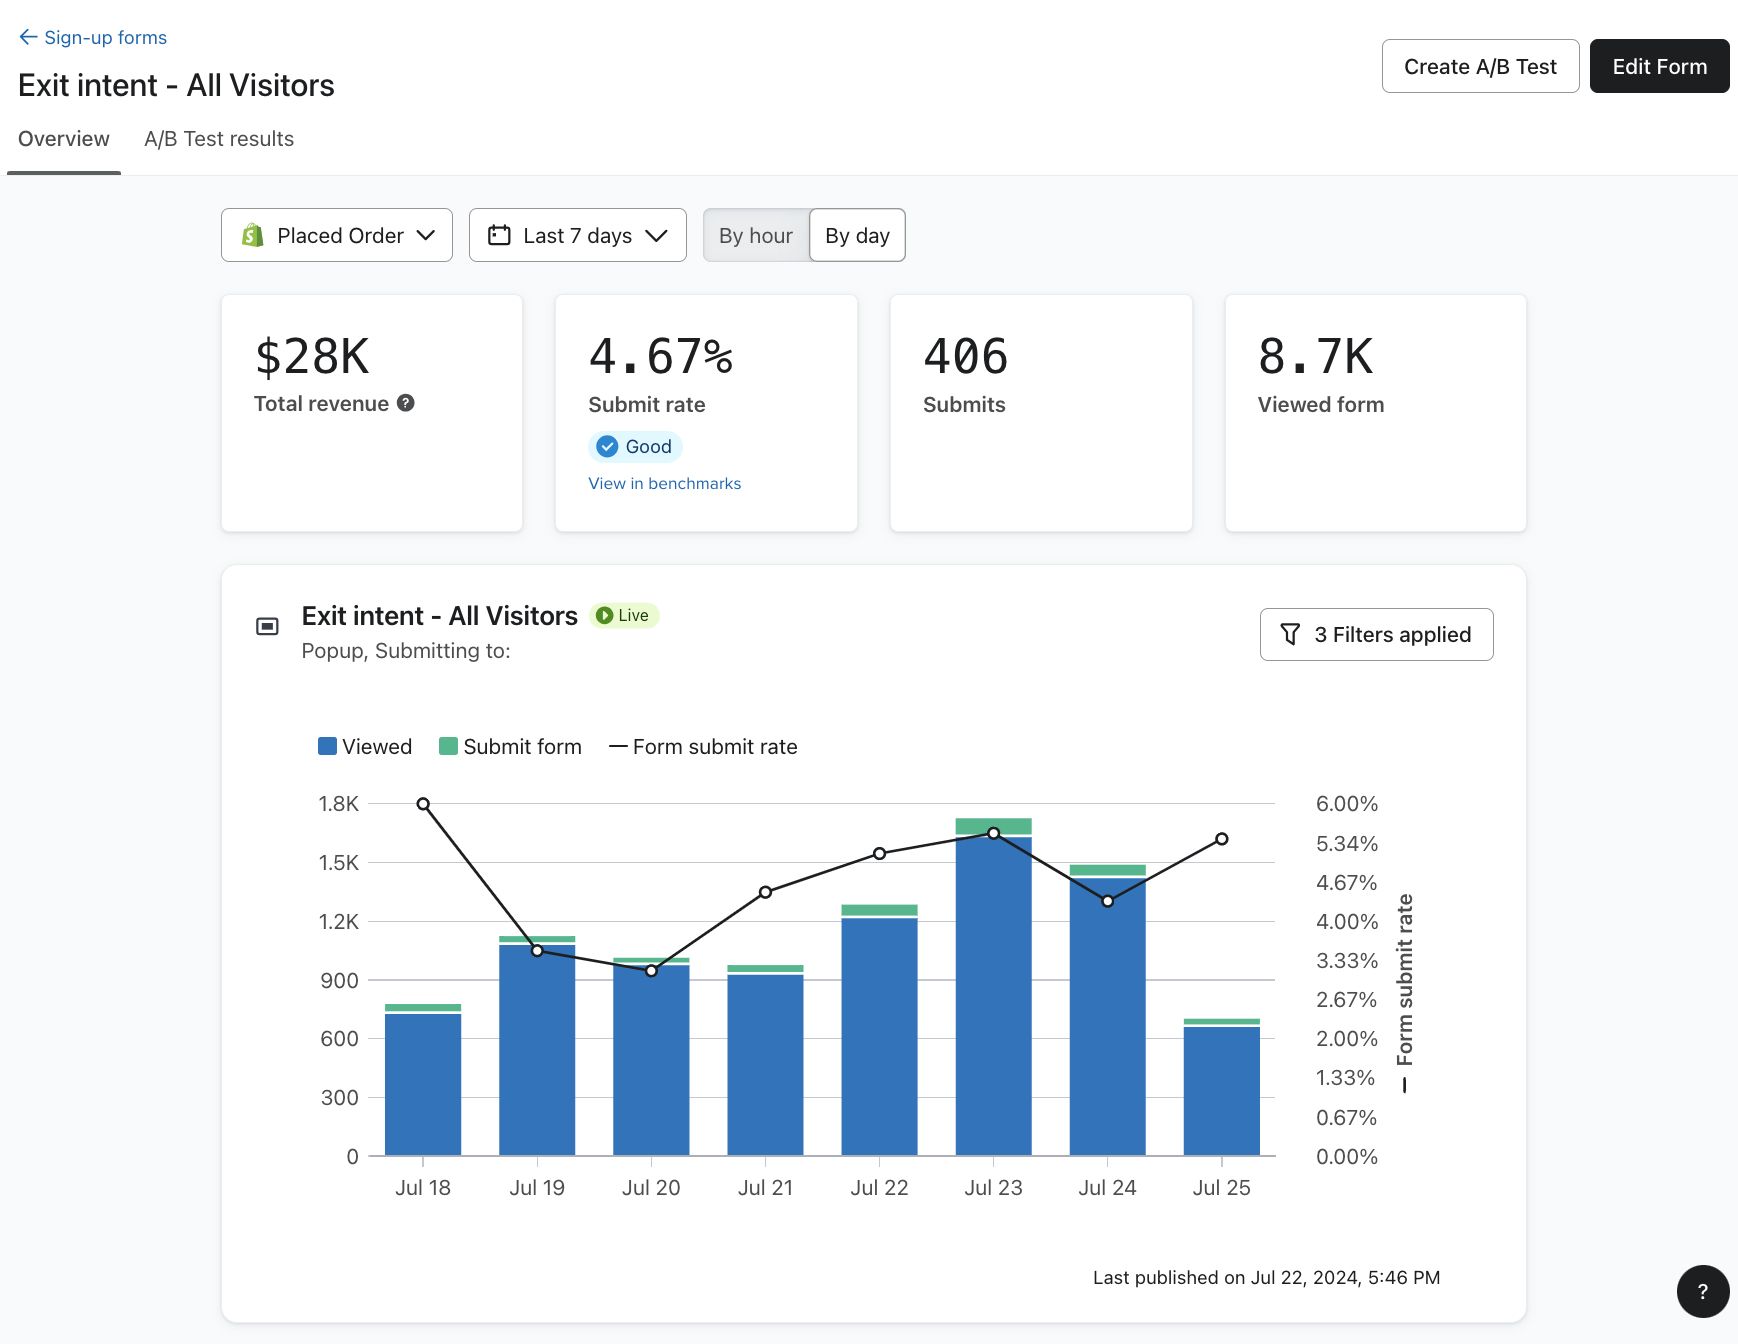
By default, the Overview page shows analytics based on Placed Order metrics, and data displays from the past 7 days, grouped by day. However, you can configure the view and date range using the dropdowns at the top, depending on how you would like to visualize your data. To analyze revenue metrics based on placed orders, keep this view as Placed order.
Note that if you set the timeframe to a date prior to December 13, 2023, engagement rates will not be available.
Metric definitions
In the Overview tab, you will see the following metrics displayed cards:
- Total revenue
This card displays the amount of revenue collected from the time a site visitor interacts with a form to purchase. Klaviyo links revenue to forms using a lookback window, which is a defined time period used to link the total revenue from a purchase to all form submissions that occurred within that period. Learn more about revenue metrics for sign-up forms.
Revenue metrics for forms are only collected as of June 5, 2024.
- Submit rate
This card displays the ratio of total submitted form events divided by the number of total viewed form events. Note that the Submit rate encompasses when any visitor submits, not solely unique profiles.
A benchmark data status icon displays on the Submit rate card, as long as the sign-up form has data during the selected time period. Select View in benchmarks to open the sign-up forms benchmarks page, which provides a view of your popup's success by comparing your submit rates to peer benchmarks.
- Submits
This card displays the total number of Submitted form events, which are tracked whenever a visitor submits the form (fills out the form entirely). A submit is also tracked if a visitor clicks a “Go to URL” button in a form without an email or phone number field. If a form includes both button types, it will only count the event when someone submits the form.
If you're using a multi-step sign-up form that collects both email and phone numbers across multiple steps, submitting whichever appears first in the form counts as a submit.
- Viewed form
This card displays the total number of Viewed form events, which are tracked whenever a site visitor views the sign-up form. Note that this encompasses the total number of times that a form has been viewed, not the number of views per unique user.
If you're using a multi-step sign-up form, this metric reflects the number of people who viewed the first step of the form.
If your sign-up form includes a teaser, the analytics will reflect actions taken on the form itself, not the teaser. This means that Viewed form represents the number of site visitors who viewed the first step of the form, not those who only viewed the teaser. Similarly, Submit rate reflects the percentage of site visitors who completed the form out of the total number who viewed the form. This calculation does not include those who viewed only the teaser.
If you're looking to view the answers submitted in your sign-up forms, see how to view sign-up form responses.
Metric graphs
There are 3 graphs on the Overview tab to help you visualize the performance data for your forms.
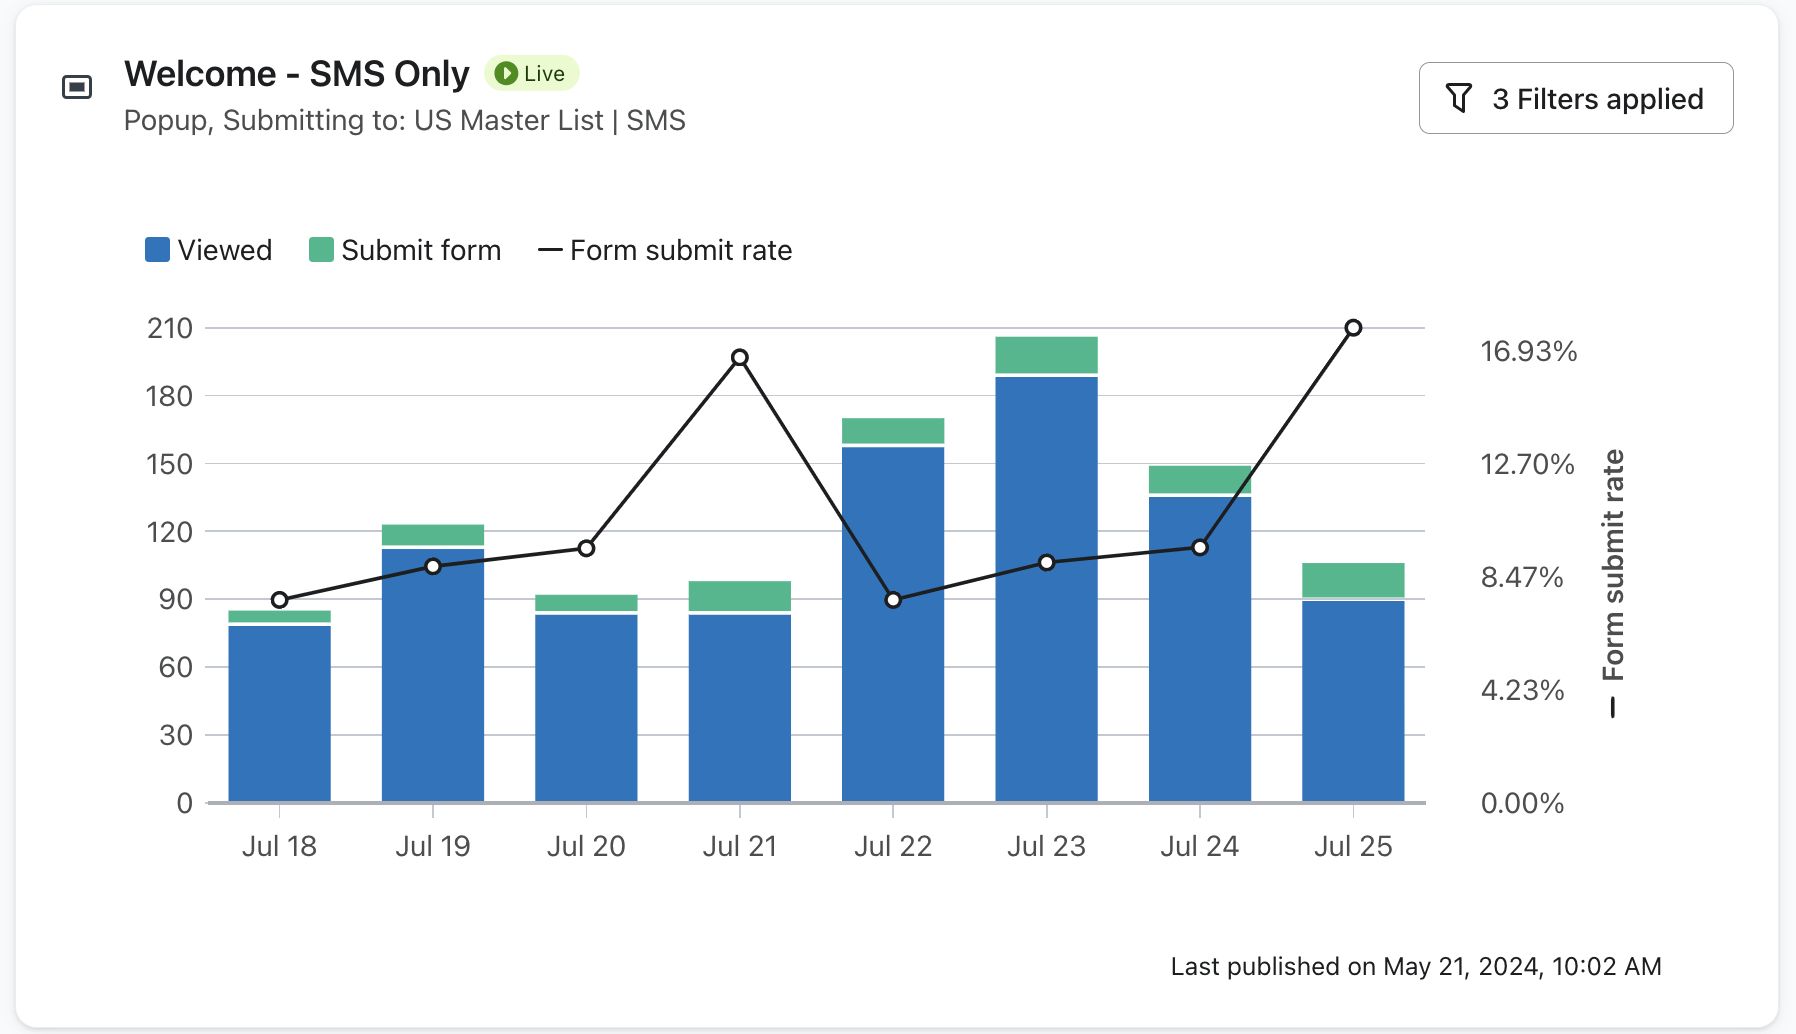
- Submission metrics graph
This graph displays form views, submits, and form submit rate for the configured date range.
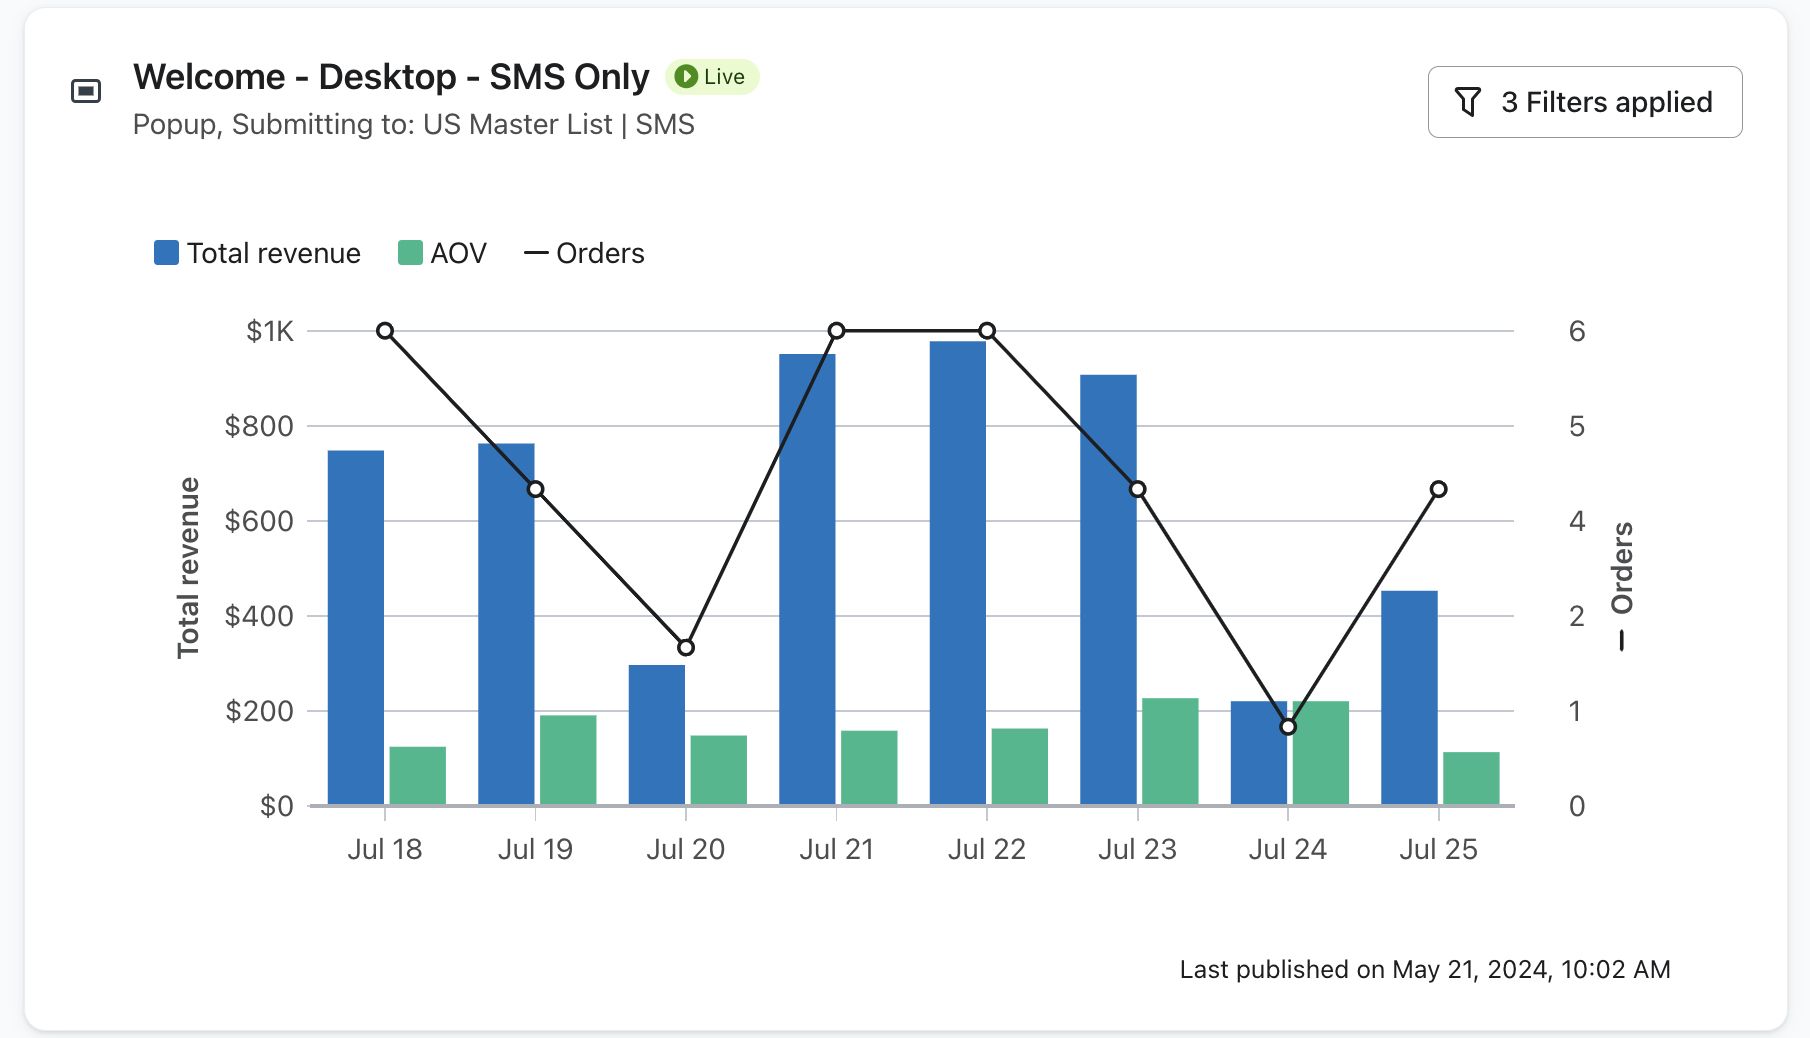
- Revenue metrics graph
This graph displays the total revenue, average order value (AOV), and orders for the configured date range. Learn more about revenue metrics for sign-up forms.
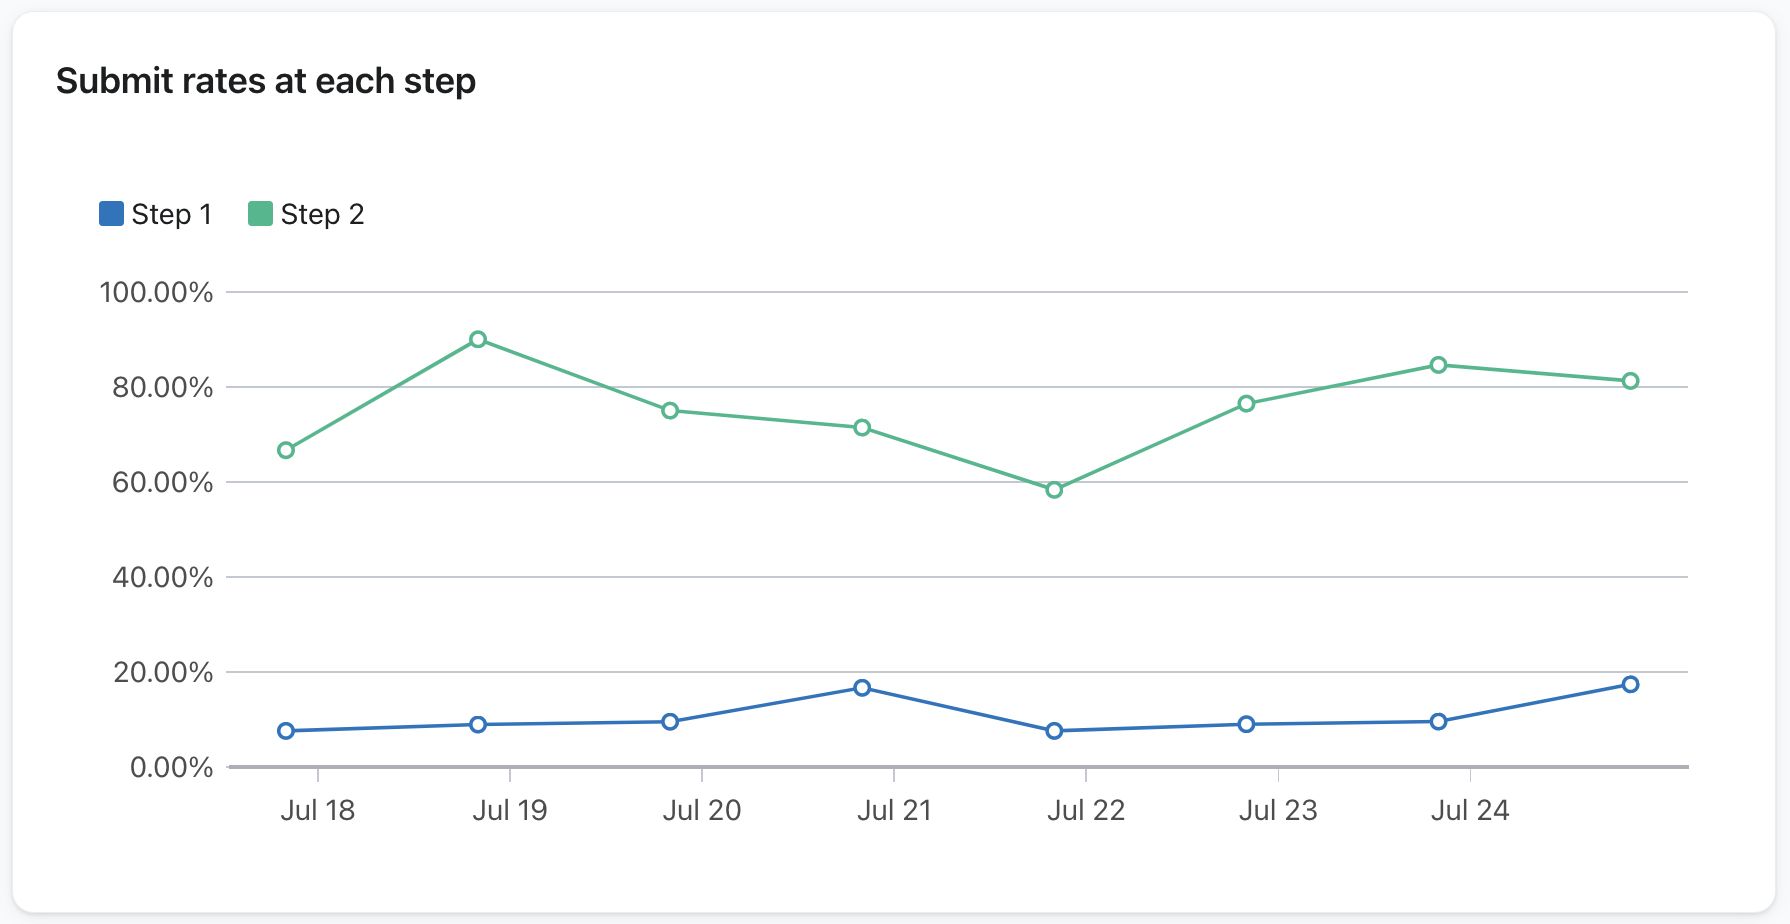
- Submit rates at each step graph
If your sign-up form has multiple steps, this graph displays submit rates for each step for the configured date range.
Engagement rates
In the Engagement rates section, analytics for each step in your sign-up form are displayed. Here you can view:
- Step 1 engagement rate
This card displays the percentage of users who engaged with the first step of your sign-up form. - Users who engaged with all steps
This card displays the percentage of users who engaged with every step of your sign-up form.
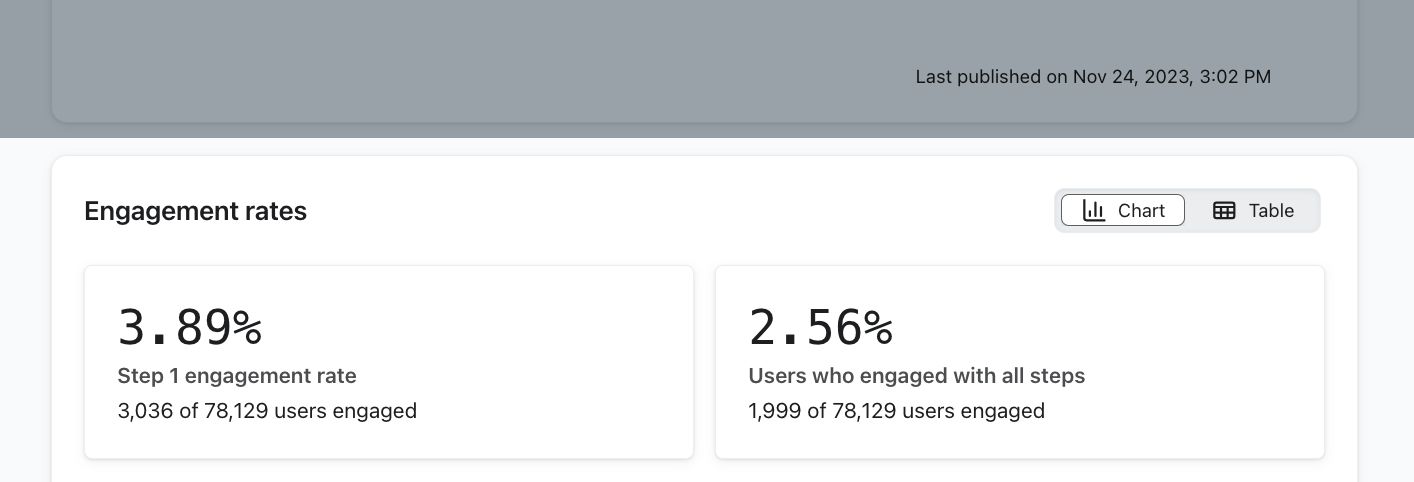
Engagement rates are calculated by the number of engaged users for a specific condition divided by the number of Viewed form events.
- A Step funnel that breaks down the engagement rates per step of the sign-up form. The form's primary conversion action is used to determine the engagement rate on each step.
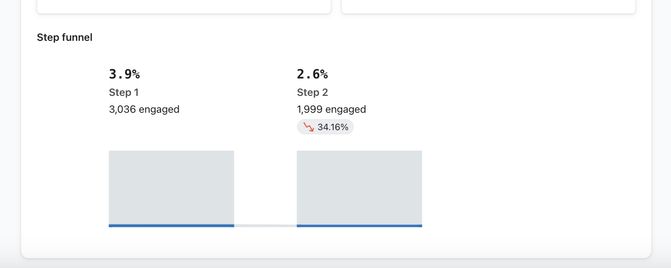
The percentage of decline listed beneath the number of engaged users reflects the percent difference in engagement rate from the prior step. This metric is calculated by subtracting the current step's Submits from the previous step's Submits, and then dividing that number by the previous step's Submits.
If your sign-up form's success step does not include a call-to-action button then it will not be included in the step funnel. This is because there are no actions for the user to take on the final step; however, if the success step features a "Close form" or "Go to URL" button, then an engagement rate will be reflected.
The Step funnel will not show if an A/B test is currently running.
Additional reports
In the Additional reports section at the bottom of the page, there is a breakdown of Viewed form, Submitted form, and Submit rate events split by a number of different options. This includes:
- Device type (desktop or mobile)
- Utm_source
- Utm_medium
- Utm_campaign
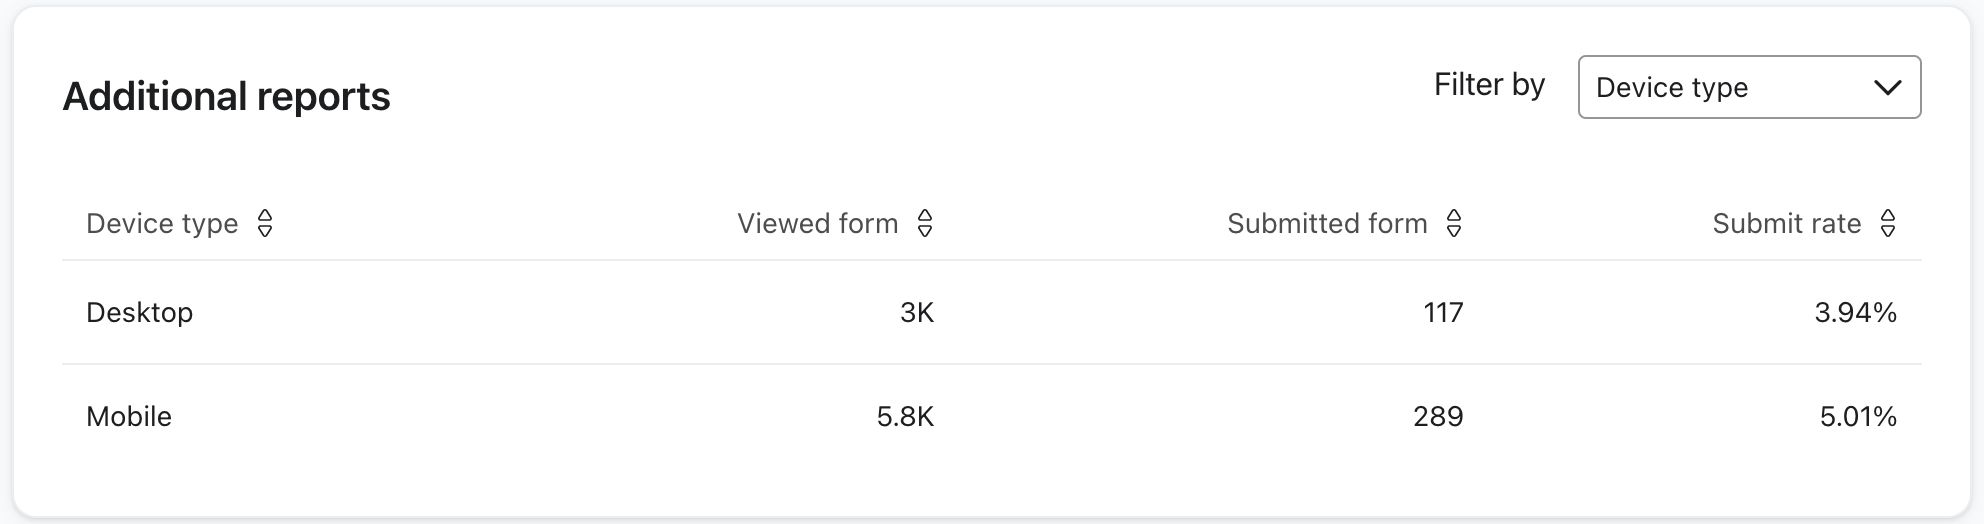
Each page will display up to 25 values, sorted by default in descending order by Form submit count; however, this is configurable depending on how you would like to represent this data.
A/B test results tab
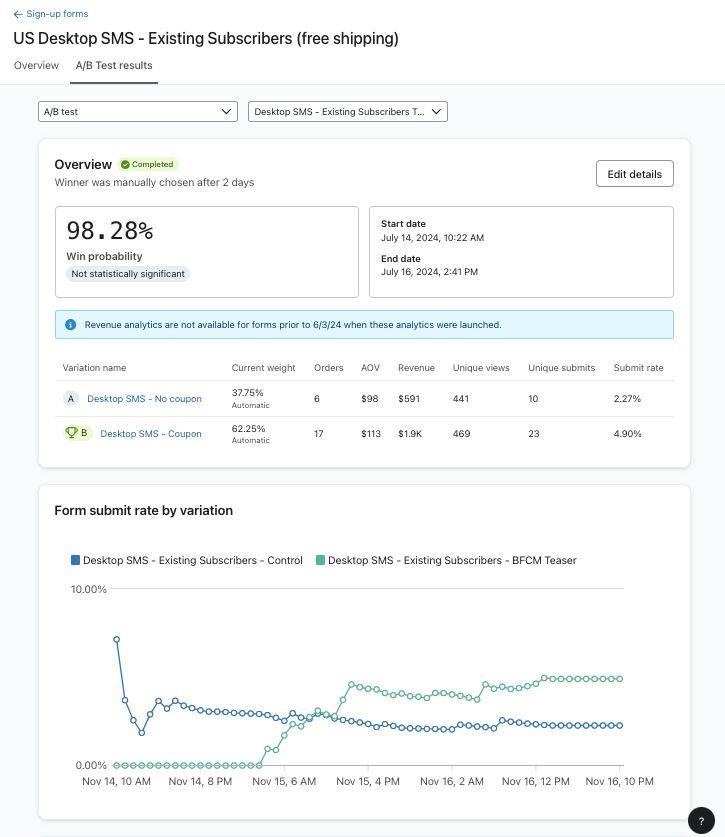
On the A/B test results page, you can measure how your A/B test is performing, or analyze results from a completed test if applicable. This page shows a graph of Form submit rate by variation, and data for each of the following metrics by variation:
If you created an A/B test before December 18th, 2023, the metrics per form variation will reflect total counts (i.e., total views and total form submissions). A/B tests created after December 18th, 2023 will show unique metrics. Using unique metrics allows Klaviyo to accurately compare success between form variations with differing display options. so you can identify how many unique users converted per each form.
- Current weight
The current weight of traffic directed to each form variation. If you have manually set the traffic distribution, the numbers will match your initial settings. If you're using Klaviyo's data science model, traffic weight will adjust over time, favoring the winning form to optimize list growth. - Orders
The number of placed orders associated with this form. - Average order value (AOV)
The store revenue associated with this form divided by the number of orders associated with the form. - Revenue
The sum of placed orders ($) which occurred after a form submission within the lookback window.
To learn more about how revenue is linked to sign-up forms, see Understanding revenue metrics for forms.
- Unique views
The number of unique users who have viewed the sign-up form variation (e.g., if 1 site visitor views your form twice, it counts as 1 unique view). - Unique submitted
The number of unique users who submit the sign-up form variation or click a “Go to URL” button (e.g., if 1 site visitor submits your form twice, it counts as 1 unique submit). If the form has both a submit button and a “Go to URL” button, it will only count the event when someone submits the form. - Submit rate
The Unique submitted value divided by the number of Unique views. Because this tare uses unique metrics, it will differ from the Submit rate on the Overview tab, which uses totals.
Note that if you are testing different display times in your A/B test (e.g., Show immediately on page load and Show 30 seconds after page load), you will see Eligible Unique Views and Eligible Submit Rate instead. Eligible views are based on the number of site visitors who could have seen this form, in order to accurately compare form variations. Head to our A/B tests FAQ to learn more.
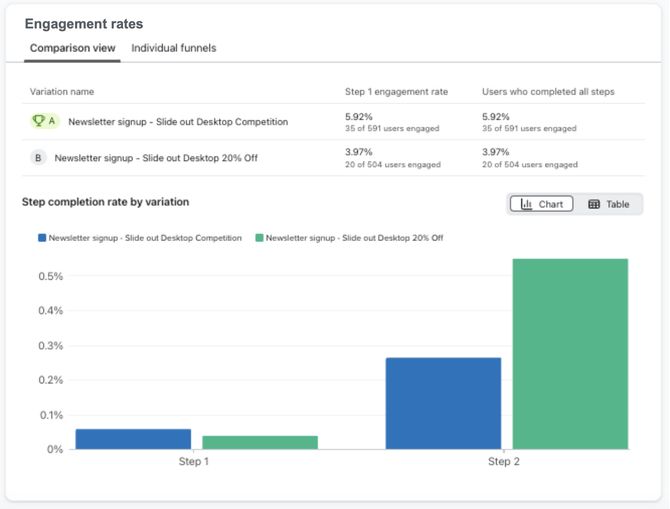
Engagement rates by variation
If you're running an A/B test on a multi-step form, you can view each variation's engagement rates for site visitors who completed step 1, and visitors who completed all steps in the form. Beneath that, the Step completion rate by variation funnel enables you to visualize engagement rates across the steps in each sign-up form variation. For more details on A/B testing sign-up forms and reviewing the results, head to how to A/B test a sign-up form.
If you started an A/B test for a sign-up form before December 13, 2023, the A/B test results tab will not display engagement rates for each variant.
Multiple sign-up forms activity
To measure performance data across multiple sign-up forms in your account, you will need to create a new analytics dashboard (also referred to as overview dashboard) report.
- Head to the Analytics > dashboards.
- Click Create dashboard if this is your first dashboard, otherwise click into an existing report from the list.
- Add the Forms Performance card to look at your overall forms' success over times.
By default, this card will display all your form submission rates over time via a line graph according to the date range you chose.
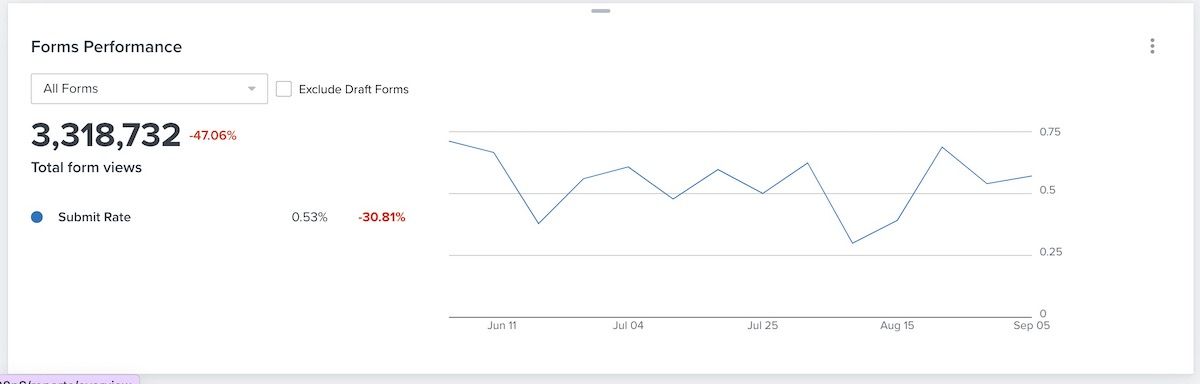
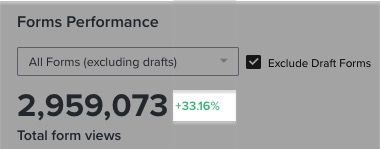
You will also see Total form views count on the left, along with the percentage change from the previous period. A positive percentage change will show in green text, while a negative percentage change will shown in red text.
Below this information, you can review your form submission rates, and how they compare to applicable peer groups (Excellent, Fair, or Poor). If you fall into the Fair or Poor categories, we suggest following the instructions above to analyze the performance for that individual sign-up form to diagnose the issue, or review ways to improve its submission rates.
Note that you can choose to remove draft forms from appearing in your data by checking the Exclude Draft Forms checkbox next to forms dropdown.
Learn more about setting up and adjusting your forms card in your overview dashboard.
What are good rates for a form?
While what "good" means for each form will differ depending on the purpose of the form, we recommend that you aim for your form submit rate for popups and flyouts to be about 3% or higher. You should also look beyond submit rate to analyze the quality of these new subscribers. Cues that indicate an engaged list include the engagement rate of the messages in your welcome series and the conversion rates for those messages.
If you're finding you have a form submit rate on Klaviyo that's less than your previous list growth tool, most likely, it is because your previous platform calculated form submit rates differently than Klaviyo does. If you're looking for inspiration to improve your sign-up forms, see Best practices for sign-up forms. If you're concerned issues are related to your forms not working properly, head to our guide on troubleshooting sign-up forms.
Additional resources
Understanding revenue metrics for sign-up forms
How to A/B test a sign-up form
Course: Klaviyo practitioner certificate