How to A/B test a sign-up form
You will learn
Learn how to use A/B testing to evaluate the performance of various elements of your sign-up forms. By effectively analyzing the results, you can ensure that your forms resonate with site visitors and contribute to list growth.
Preparing for your A/B test
Before you start creating your A/B test, consider these general guidelines:
- Test 1 variable at a time (e.g., coupon offering)
- Focus on changing a single variable (element) at a time, such as a coupon, to clearly assess its impact.
- Start small with test variations
- When testing a variable (e.g., coupon offering), begin with 2 variations to measure effectiveness. You can increase complexity in later tests as you collect more data, but aim for no more than 4 variations for reliable results with less traffic.
- Avoid mid-test changes
- Avoid changing test settings while a test is live, so confirm your settings beforehand. You can't edit the content of the running variations. To prepare content changes, create a draft copy of the test; the current test stays live until you publish the new one.
- Allow for substantial test duration
- Wait for statistically significant results or until you have a sufficient sample size of viewers to end your test. Remember, more variations require more traffic for reliable results.
- Understand statistical significance
- Familiarize yourself with how statistical significance impacts the results of an A/B test.
What to A/B test
Use case | Goal | Setup |
Test a popup with a teaser | Measure the effectiveness of a teaser in your popup form. | Create 2 identical variations of your form, 1 with a teaser and 1 without, and compare results. Learn more about teasers. |
Test display timing | Determine the optimal timing for displaying your form on your website. | Test variations with different Timing settings (e.g., 1 appears after a visitor has scrolled a certain amount and the other at exit intent). Timing is configured in the Targeting & display behavior panel of the form editor. Learn more about display timing. |
Test your form with a coupon offer | Assess if providing a promotional discount in a form boosts submissions. | Create 2 variations, 1 offering a coupon and 1 without. Once a winner is declared, further test types of coupon offers (e.g., 10% off vs. free shipping). Learn more about coupons in forms. |
Test your form's content | Test to learn what form copy, imagery, or layout resonates with site visitors and increases submit rates. | Test 1 content element at a time across multiple variations, such as:
|
Creating an A/B test
Creating a test
There are 2 different ways to create an A/B test for your sign-up form:
- On the Sign-up forms tab, click the 3-dots dropdown menu next to the form you'd like to test and select Create A/B test.
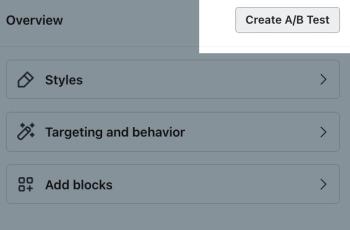
- Open the form editor for the sign-up form you'd like to test. Select Create A/B test in the left sidebar, then click Create A/B test in the panel.
No matter where you enter from:
- In the Create test window, select A/B test if a test type selector appears.
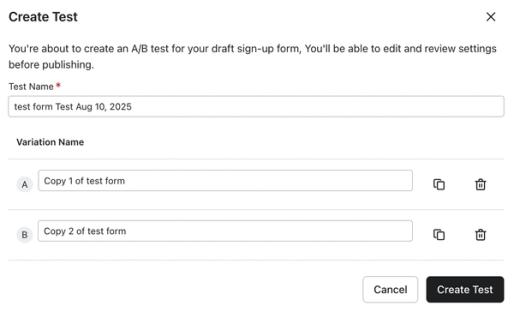
- Next, name your test something descriptive. If you’re testing colors of the buttons on your newsletter popup, you could name the test Newsletter - Color of Submit Button.
- After you’ve named your A/B test, give your sign-up form variations different names so you can distinguish between them.
- By default, it will come with the name Copy # of Name of Form. With the different color submit button example from before, you might have your forms named Newsletter - Blue and Newsletter - Gray.
- Here, you can also add more variations by selecting the copy button. Your A/B test can contain up to 7 variations in total. Keep in mind, the more variations you add, the longer you’ll need to run your test. An ideal A/B test would have between 2 and 4 variations. In the example below, there are 3 variations: the original form and the 2 additional tests.
- After you’ve configured your test, select Create test.
Configuring the variations
After you’ve created your test, you’ll be directed back to the sign-up form editor. In the Create A/B test panel, select a variation's letter (A, B, and so on) to edit it. Use the name field, copy icon, or delete icon beside a variation to rename, duplicate, or delete it.
See the What to A/B test section for inspiration.
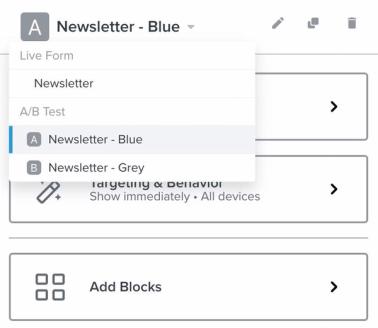
Once you’re done configuring your form, select Continue to test settings.

Configuring A/B test settings
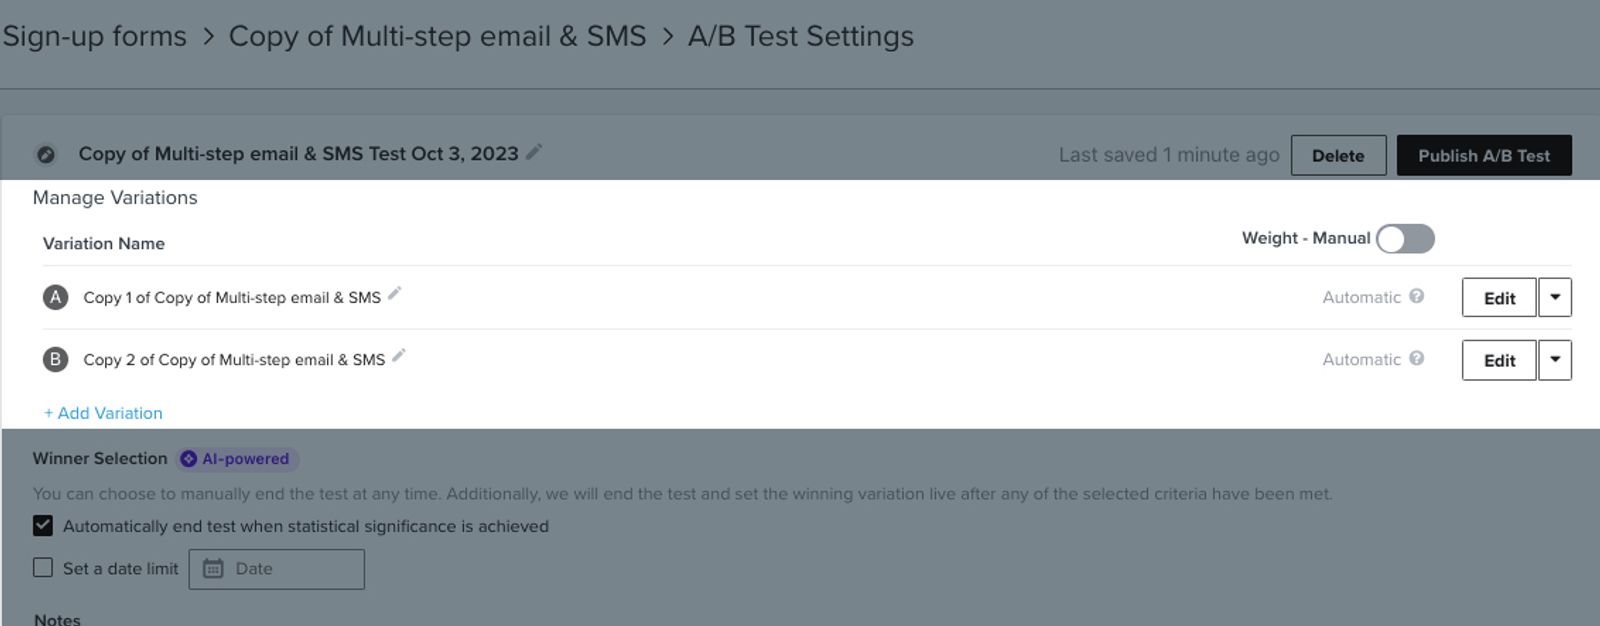
On the test settings page, you can customize:
- Variation names
- Traffic selection (Weight)
- Winner selection
- Notes
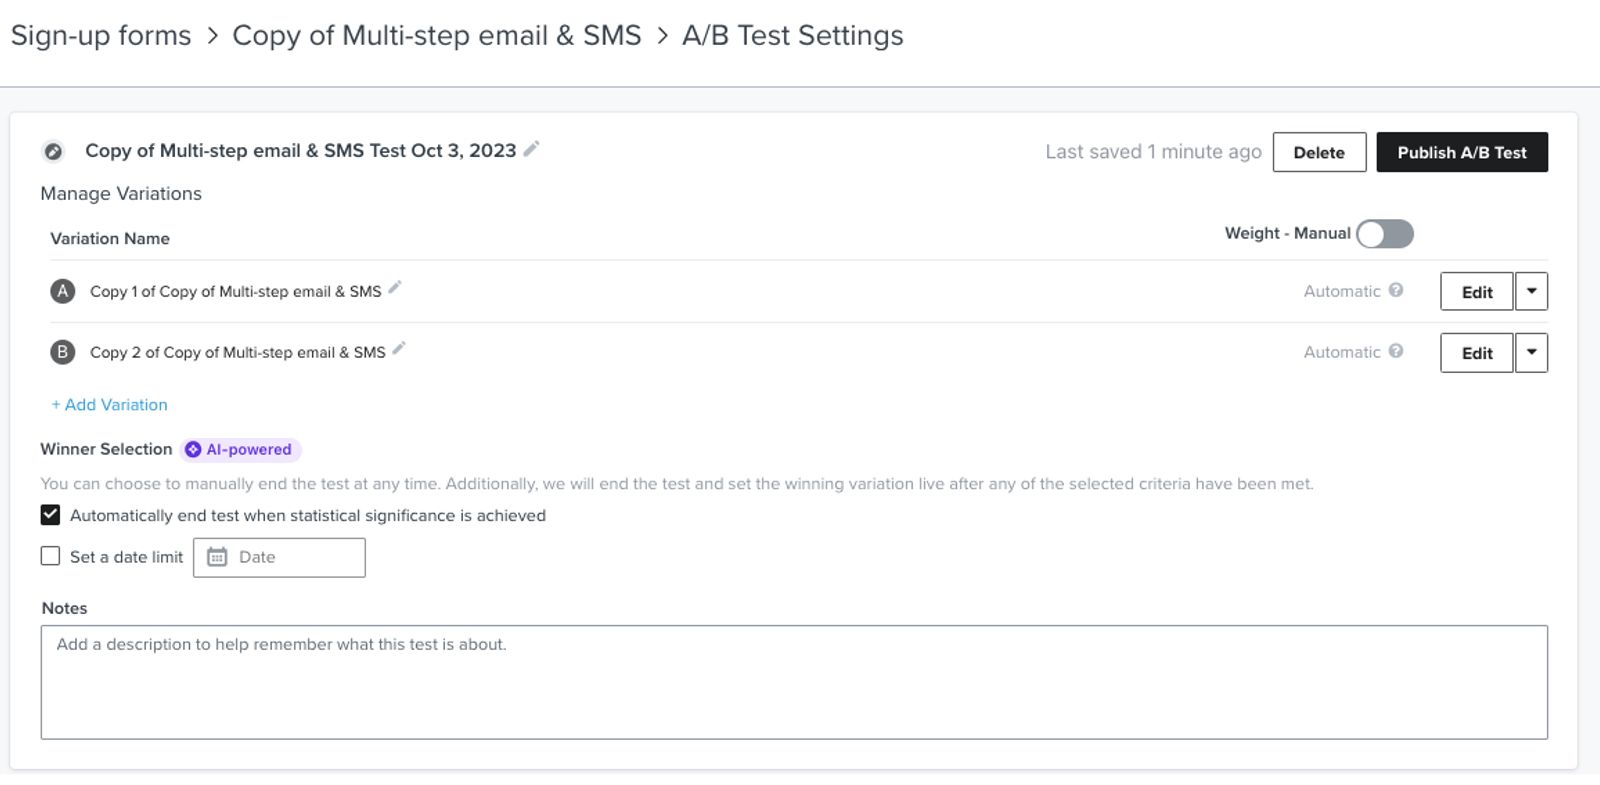
For a running test, you can also select your form on the Sign-up forms page, then select A/B test results > Edit A/B test.
Traffic selection
From this section, you can determine how much traffic goes to the variations of your form. By default, each form will appear to an equal amount of viewers. As your test runs, if one of your variations is outperforming the rest, Klaviyo will direct traffic to the better performing form while the test is still running.
Turn on Set traffic manually to specify the percentage of traffic that goes to each variation. When you change a percentage, Klaviyo adjusts the other percentages so the total remains 100%.
Winner selection
Similar to the traffic selection section, you have 2 options in determining how to choose the winner of the test. You can end the test automatically or manually.
- Automatically
If you end your test automatically, it will end when there is 1 variation that outperforms the other(s) at a statistically significant level or when it reaches a particular date. You can also select both boxes and the test will end when 1 of the conditions are met. For example, if you have both conditions selected and your form will only run for a month, if the form has statistically significant results after a week, the test will end.- If you end your test when the results are statistically significant alone, Klaviyo’s data science model will do the math for you and pick a winner.
- If you choose to end the test on a particular date, the test will end at midnight coordinated universal time (UTC).
- Manually
If you choose to end your test manually (uncheck both boxes), you will choose both the winner and the date that the test ends.
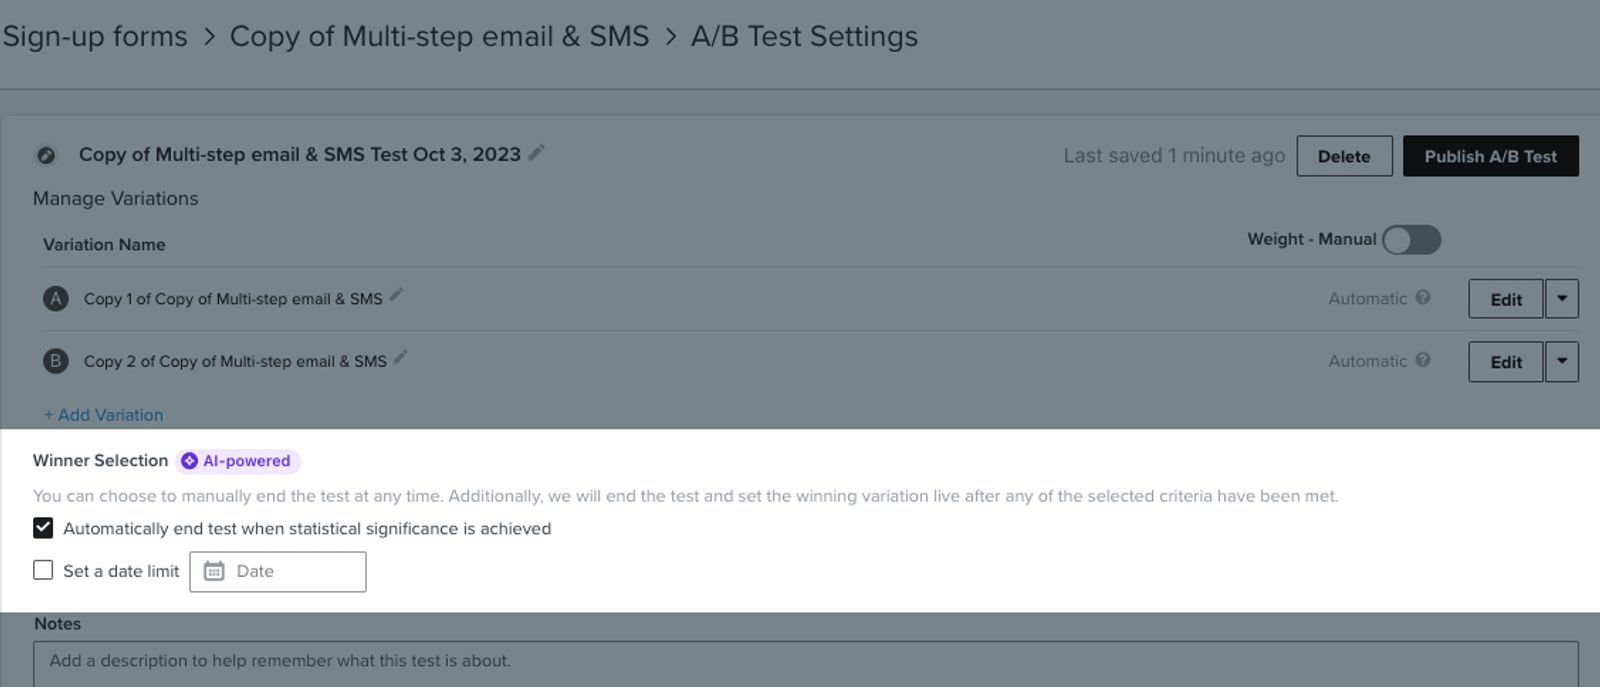
Regardless of which automatic selection you pick, after the test has finished, the form that wins will be live on your site.
- Select Publish A/B test once you've finished editing your test settings.
- Review the installation and content checks in the confirmation window, including any consent language or form-field issues. If your test includes an embedded form, make sure its embed code is installed where the form should appear.
- Select Publish to start the test.
Review A/B test results
While the test is running or after you’ve completed your A/B test, you can monitor the data in your account. Navigate to Sign-up forms, then select your form. On the Overview tab, you can see how your form is performing overall. Select the A/B test results tab to dive into the analytics of your A/B test specifically.

For a running test, you can also edit your A/B test's settings. To do so, select Edit A/B test in the top right corner of the A/B test results tab. Here you will be able to edit the test settings (i.e., name, variation weight, winner selection settings).
You can’t change the content of the running variations. On A/B test settings, select Edit Content, enter a name for the new test, and select Continue to create a draft copy. The current test stays live while you edit the copy. When you publish the new test, it replaces the current test.
Test overview
Under Overview, you’ll get a snapshot of how your test is performing. Use the test dropdown above this section to switch between current and previous A/B tests. The metrics shown in Overview include:
- Win probability
The win probability displays in the top left card. This percentage estimates the likelihood that the leading variation’s form submit rate is truly higher than the rates of the other variations. It can rise or fall as more data is collected. The label below the win probability shows whether the results are statistically significant. For a completed test, the overview also shows whether it ended automatically or manually. - Start date and End date
The start and end dates for the test are listed in the top right card. While the test is running, End date shows a placeholder, even if you set an end date. Once the test ends, it shows the actual end date and time.
To manually stop a running test, select Choose winner. Choose the variation and whether to set it live or to draft. Setting it to draft removes the form from your site. Select Choose Winner again to confirm.
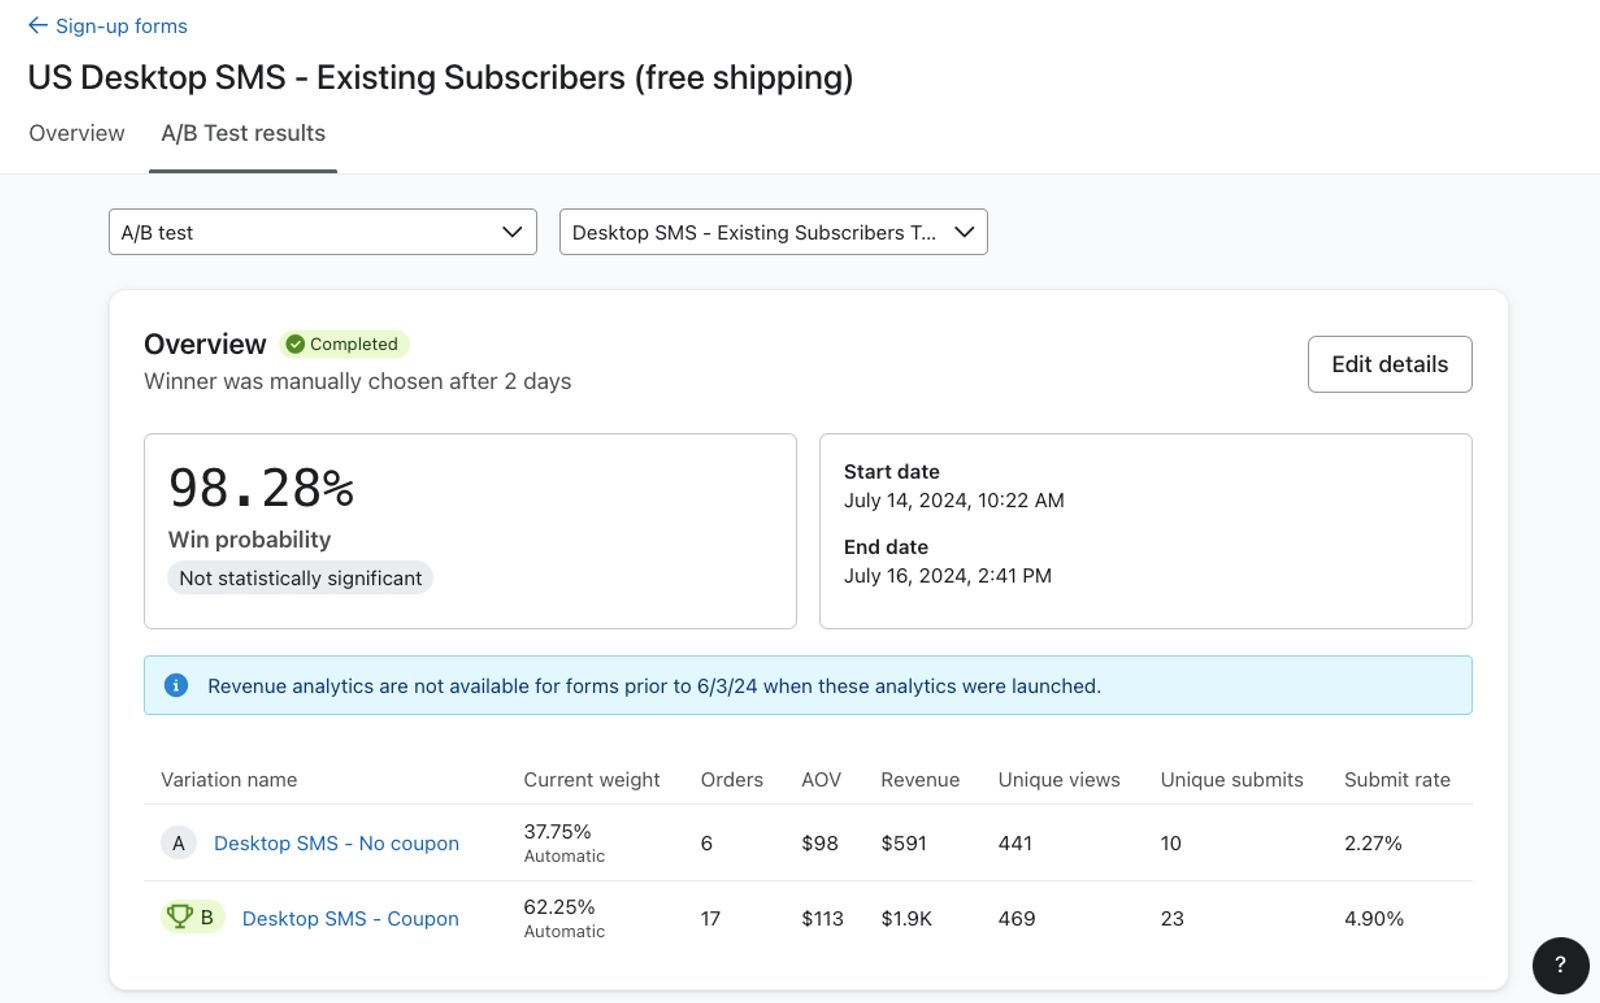
Beneath these cards, the raw data from each form variation in your test is displayed. Next to each variation, you can see a breakdown of the following metrics by variation:
- Current weight
This metric reflects current weight of traffic directed to each form. If you have manually selected how much traffic goes to each form, these numbers will be consistent with your current manual traffic settings. If you’re using Klaviyo’s data science model, you will see the weight of traffic changing over time, giving more traffic to the form that is winning and letting you gain more subscribers as you run your test. - Orders
The number of placed orders attributed to this form. - Average order value (AOV)
The store revenue associated to this form divided by the number of orders associated with the form. - Revenue
The sum of placed order values linked to this form within the configured lookback window. Your form revenue settings determine whether revenue is linked after a visitor submits a step or reaches the success step.
To learn more about how revenue is linked to sign-up forms, see Understanding revenue metrics for forms.
- Unique views
The number of unique users who have viewed a sign-up form variation (e.g., if 1 site visitor views your form twice, it counts as 1 view). - Unique submits
The number of unique users who submit a sign-up form variation or click a "Go to URL" button (e.g., if 1 site visitor submits your form twice, it counts as 1 submit). If the form has both a submit button and a “Go to URL” button, it will only count the event when someone submits the form. - Submit rate
The Unique submits value divided by the number of Unique views. Because this rate uses unique metrics, it can differ from the Submit rate on the Overview tab, which uses totals.
Note that if you are testing different display times in your A/B test (e.g., Show immediately on page load and Show 30 seconds after page load), you will see Eligible unique views and Eligible submit rate instead. Eligible views are based on the number of site visitors who could have seen this form, in order to accurately compare form variations. Scroll down to the FAQs to learn more.
Form submit rate graph
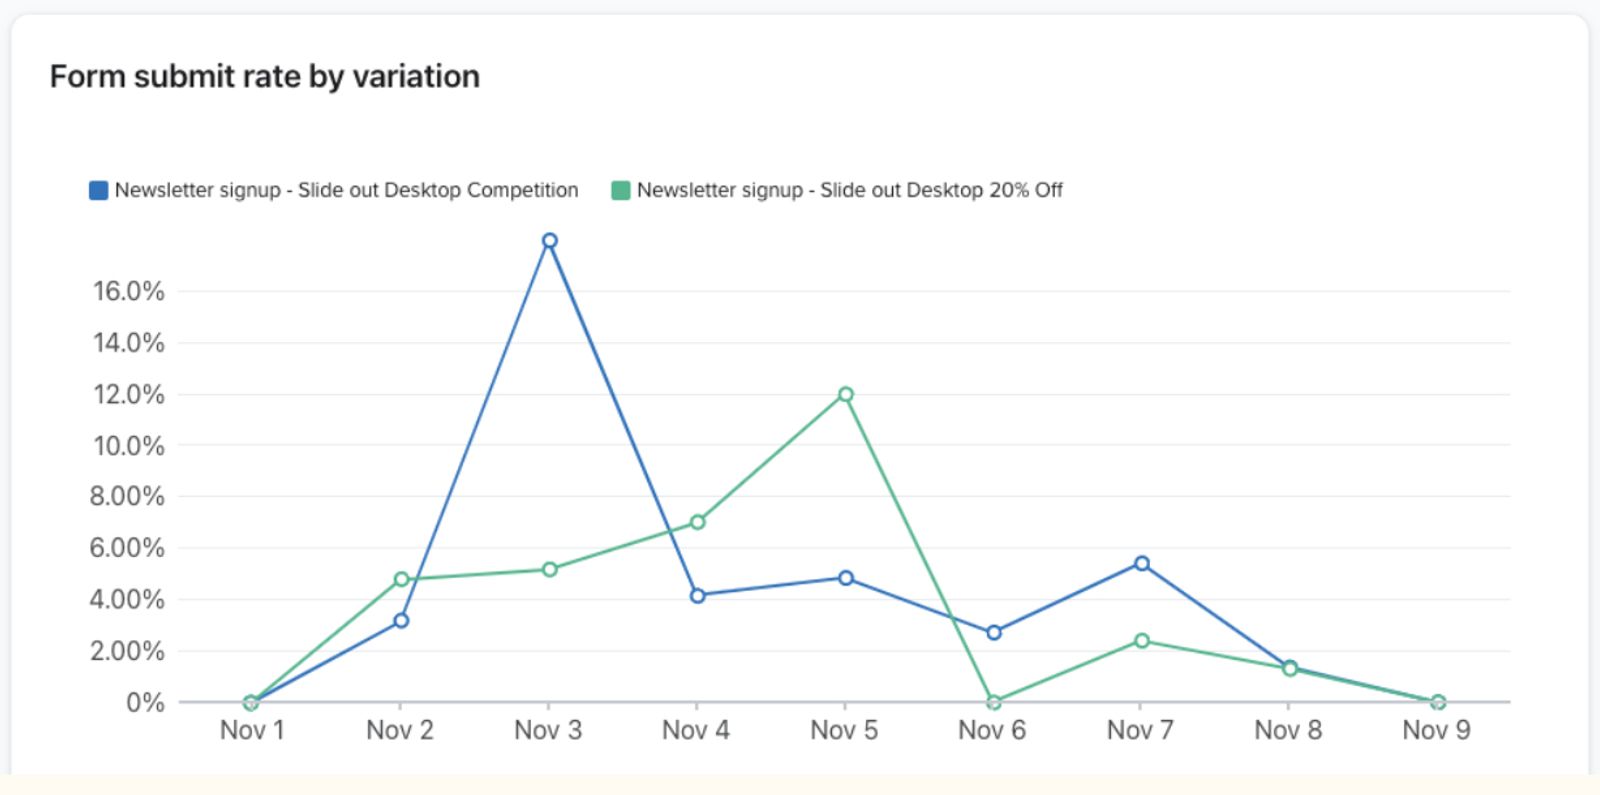
Beneath the raw data is a plot of your variations, showing the Form submit rate by variation over the duration of the A/B test. If you’re interested in a particular date, hover over data points for more information.
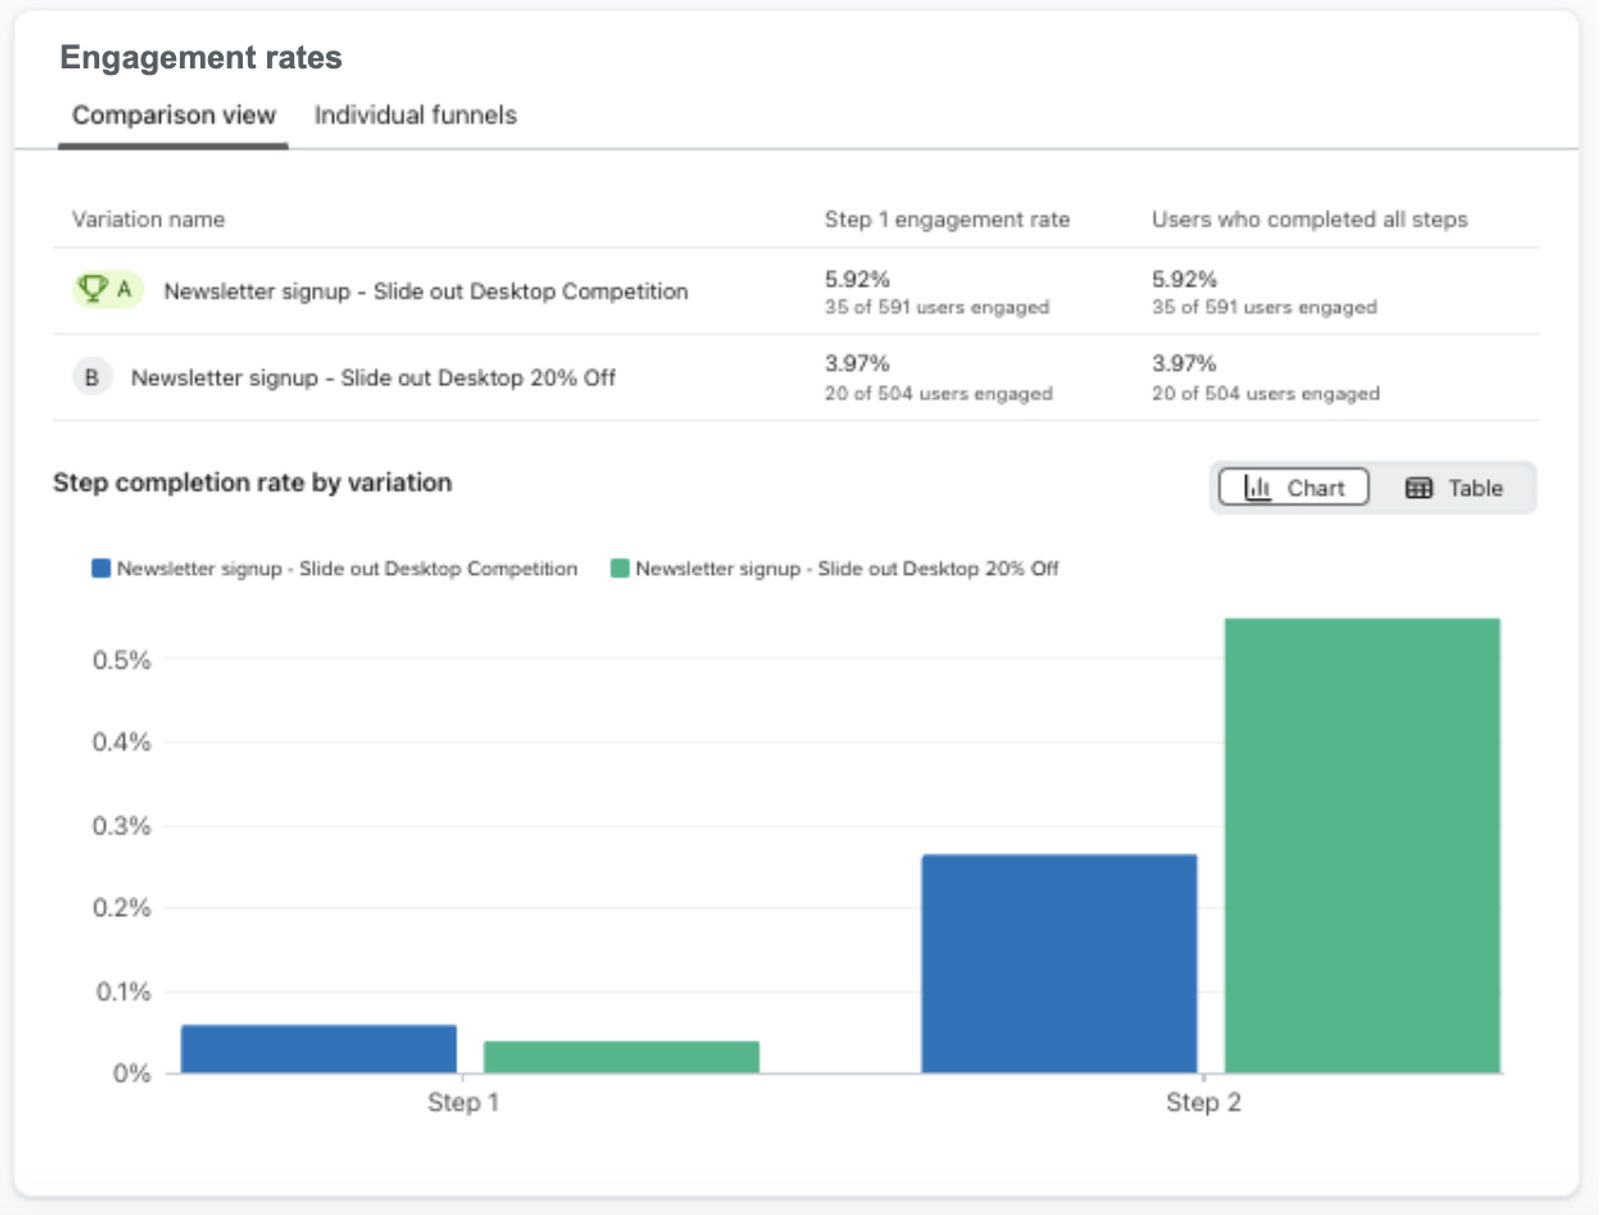
Engagement rates
If you're running an A/B test on a multi-step form, there is a breakdown of the engagement rates for each step in the form per variation, so you can understand where site visitors may be abandoning the form. Here you can analyze:
- Step 1 engagement rate
This metric reflects the percentage of users who engaged with the first step of the sign-up form variant. - Users who completed all steps
This metric reflects the percentage of users who engaged with every step of the sign-up form variant.
Beneath this data, there is a Step completion rate by variation chart, so you can visualize the engagement rates per step, and compare rates between form variations in the A/B test.
FAQs
I have a notification that my time-delay A/B test calculates form submit rate differently. Why is that?
If you’re testing a time delay on your form, your form submit rate will be calculated by looking at the conversions of unique users eligible to see your form (Eligible unique views), rather than the number of unique visitors who actually viewed the form.
Say, for instance, your A/B test is evenly weighted and has the message, “Need help browsing?” In the test, 1 form shows immediately upon someone visiting your site, and the other form loads after a minute. While the same number of people will be queued up to see both forms, more people will see the form that shows immediately. While there will not be as many people who see the form with the delay, it offers help to confused shoppers, and thus could still have a greater form submit rate. To test if the form delay leads to a higher or lower submission rate, the form submit rate will not be the amount of submits as a percentage of the number of views, but rather the amount of submits as a percentage of the number of people who could have seen the form.
I selected both boxes for the Winner selection part of my A/B test. Will the test end when both or either one of the conditions are met?
These checkboxes function as an OR condition, meaning that either one of the conditions can be met and the test will stop. Both conditions do not need to be met for the test to stop.
Can I edit the test settings for my form A/B test after it's already running?
Yes. Open your form's A/B test results and select Edit A/B test to change the settings. To change form content, use Edit Content to create a draft copy. The current test stays live until you publish the new test.
If someone doesn’t engage with a form that is a part of an A/B test, when the form shows to them a second time, will they see a different version of the form?
Klaviyo uses saved browser data to show the same variation again during the test. A visitor may see a different variation if that data is cleared or unavailable, such as in a new private browsing session.
When I create an A/B test for my form, will my form go to draft mode?
The form will stay at whatever state your form was in before you created the test. If it was live mode and you create an A/B test, the current version will be live. If it was in draft, the form will be in draft mode.
I had a typo in my form A/B test, so I published a new one. How can I permanently delete the test with a typo?
Deleting test results is permanent. Open your form's A/B test results and select the completed test from the test dropdown. Open the arrow menu beside Edit details, select Delete test results, then select Delete A/B Test to confirm.
I set my form A/B test live, then afterward I realized I had a typo. I don’t want to stop the test, re-build it, and set it back live. What should I do?
- From your form's A/B test results, select Edit A/B test, then Edit Content.
- Enter a name for the new test and select Continue.
- Edit the draft copy. Use the variation letters in the editor header to switch between variations.
- Select Continue to test settings in the editor header to review the settings.
- Select Publish A/B test and confirm with Publish. Your original test stays live until you publish the replacement.
One of my form variations is performing very poorly and I want to update the amount of traffic going to the form. Can I do that?
Yes. Open your form's A/B test results and select Edit A/B test. Turn on Set traffic manually to change the percentages, or turn it off to let Klaviyo adjust traffic based on performance.
I want to test to see if different offers are more likely to convert. How do I make sure to give a different welcome series correlated to each form?
You can adjust the list that a person is submitting to for each variation. To make each variation go to different lists, click on your CTA button in the form and change the List to Submit under the Button click action section. From there, trigger your welcome series flow based on someone joining each variation’s list and follow up with the associated offer.
I want to track who submits each form variation of the A/B test. How can I do that?
There are 2 ways to identify people who submit each variation. You can adjust the list that a person is submitting to or add a hidden field to their profile when they submit the form. These methods do not identify everyone who only views a variation. To use separate lists, select each variation's submit button and change List to Submit under Button click action. To use a hidden field, add a property under Submit hidden fields and give it a different value for each variation. Then create a segment based on the property and value.
Additional resources
- Best practices for A/B testing reference
Learn best practices for using Klaviyo's A/B testing features to help optimize your communication with customers.
- Getting started with sign-up forms
Learn how to create and customize sign-up forms in Klaviyo to publish on your website so you can engage shoppers, collect emails and phone numbers, and build long-lasting customer relationships.
- Creating an effective acquisition strategy using sign-up forms
- Enhance your marketing with A/B testing