벤치마크 페이지를 맞춤 설정하는 방법
학습 내용
비즈니스 요구 사항에 가장 잘 맞게 벤치마크 페이지를 맞춤 설정하고 브랜드에 가장 유용한 데이터를 찾는 방법을 알아보세요. Klaviyo의 벤치마크 도구에는 동종 업계 및 업계 트렌드와 비교해 성과를 확인할 수 있도록 맞춤 설정할 수 있는 4개의 데이터 페이지가 있어요. 이 페이지에는 개요, 비즈니스 성과, 캠페인 성과, 플로우 성과가 포함돼요.
Klaviyo 벤치마크는 현재 이메일 데이터를 반영하며 SMS 데이터는 포함하지 않습니다.
개요 페이지 사용자 정의
벤치마크 개요 페이지에는 성과가 좋은 계정 지표와 성과가 좋지 않은 계정 지표에 대한 요약이 표시돼요.
1. 이 데이터 세트의 조회 기간을 조정해 특정 기간에 집중하고 추세를 추적할 수 있어요. 이렇게 하려면 표시 옆의 드롭다운을 클릭하세요.
2. 다음 범위 중 하나를 선택하세요:
- 지난 달
- 지난 3개월
- 현재까지의 분기
- 지난 분기
- 지난 12개월
- 현재까지의 연도
- 작년
- 모든 시간
- 사용자 정의 날짜 범위
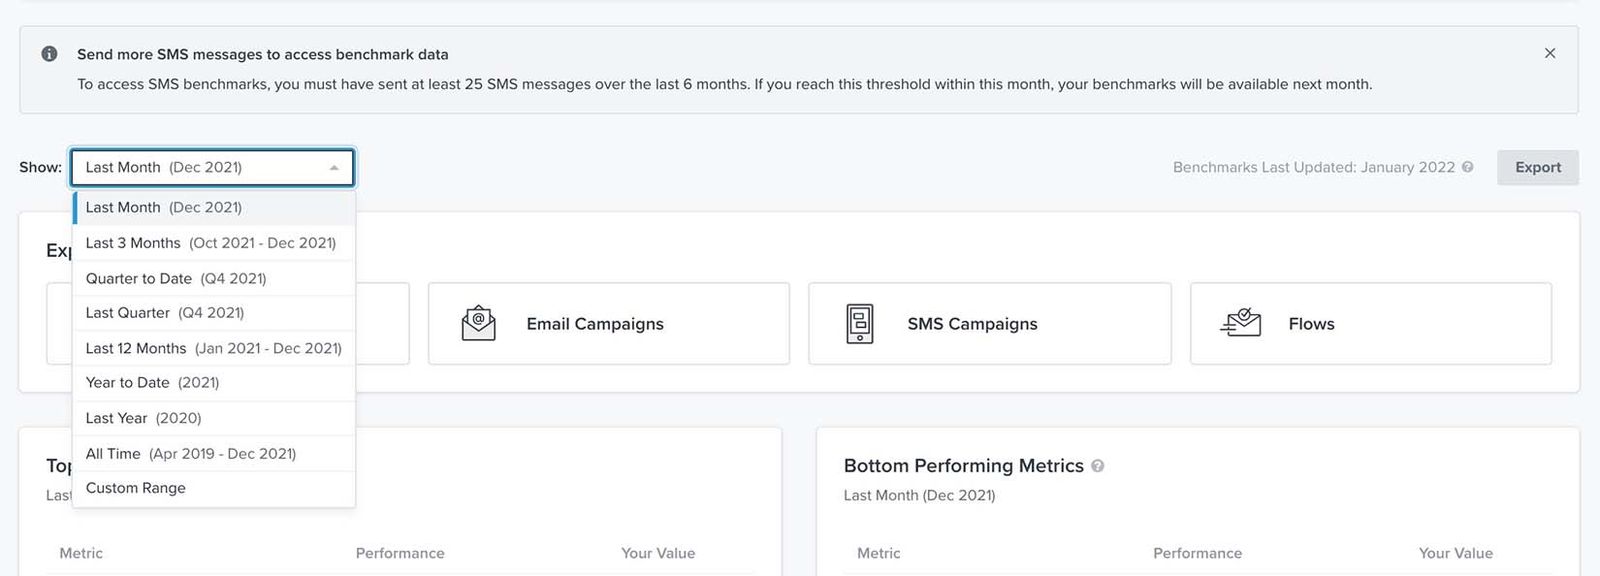
이 범위에서는 월이 달력 기준 월을 따르며, 각 분기는 정확히 3개월에 해당해요. 분기는 북미 Q1/Q2/Q3/Q4 형식을 기준으로 정의되며, Q1은 1월부터 3월까지에 해당해요.
비즈니스 성과 페이지 맞춤설정하기
비즈니스 성과 페이지에서는 전반적인 비즈니스 상태와 관련된 주요 성과 지표의 세부 정보를 확인할 수 있어요. 그래프와 표 형식에서 모두, 볼 그래프, 그래프의 성과 지표, 데이터의 기간을 맞춤 설정할 수 있어요.
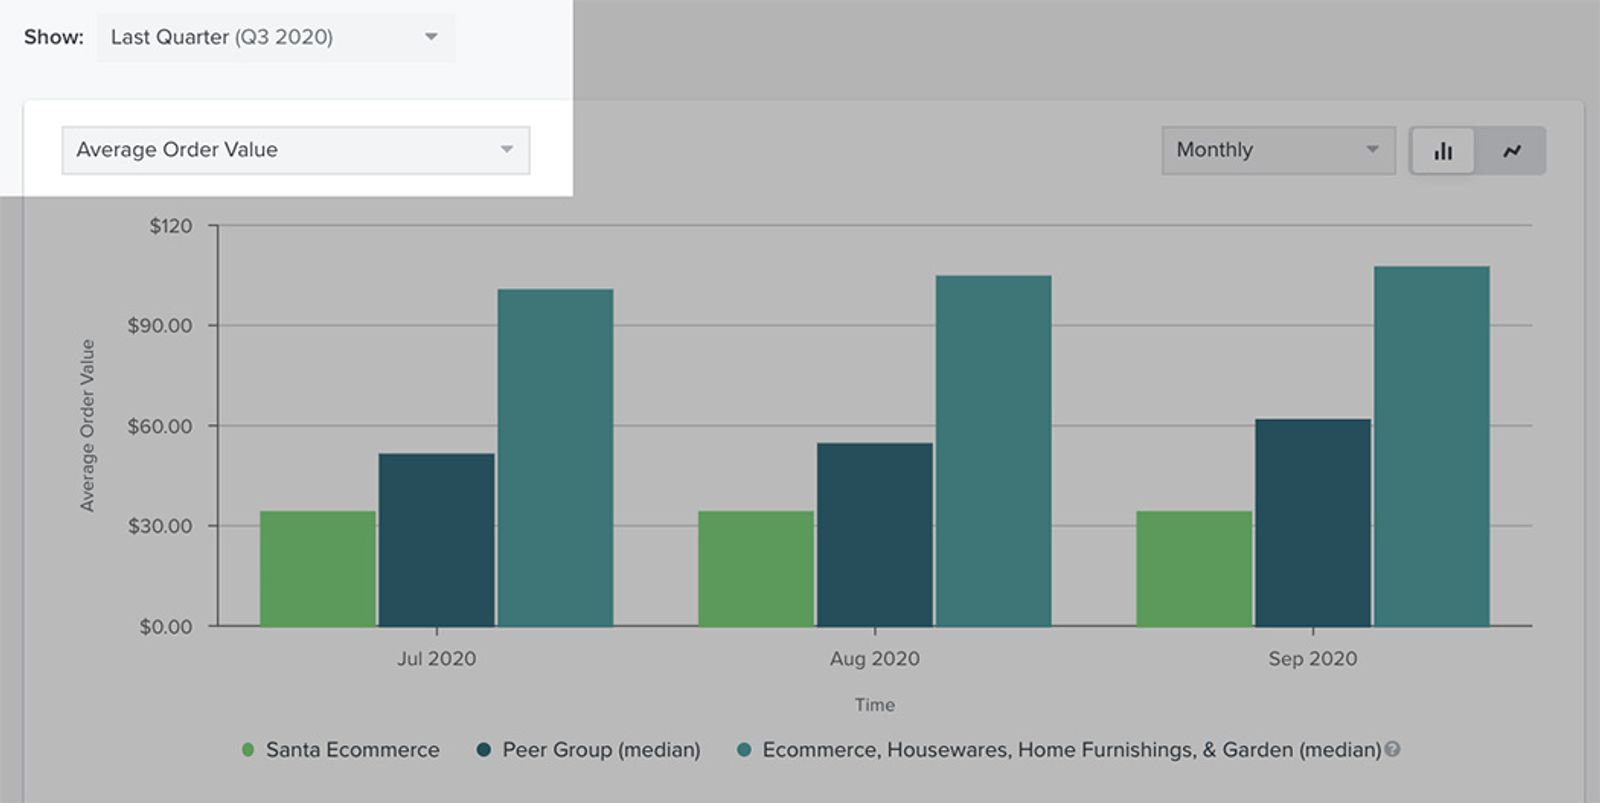
1. 그래프 카드의 왼쪽 상단에서 Show 옆 드롭다운에서 데이터에 원하는 기간을 선택해 주세요.
2. 그런 다음, 기간 드롭다운 바로 아래에서 분석하려는 성과 지표(예: 평균 장바구니 크기, 평균 주문 수, 평균 주문 금액 또는 반품된 주문 비율)를 선택해 주세요.
다른 Klaviyo 보고서와 달리, 벤치마크 보고서에서는 평균 주문 수 숫자가 선택한 종료 날짜까지 합산돼요. 예를 들어 지난달의 평균 주문 수를 보고 있다면, 지난달 종료 시점까지의 총합이 될 거예요.
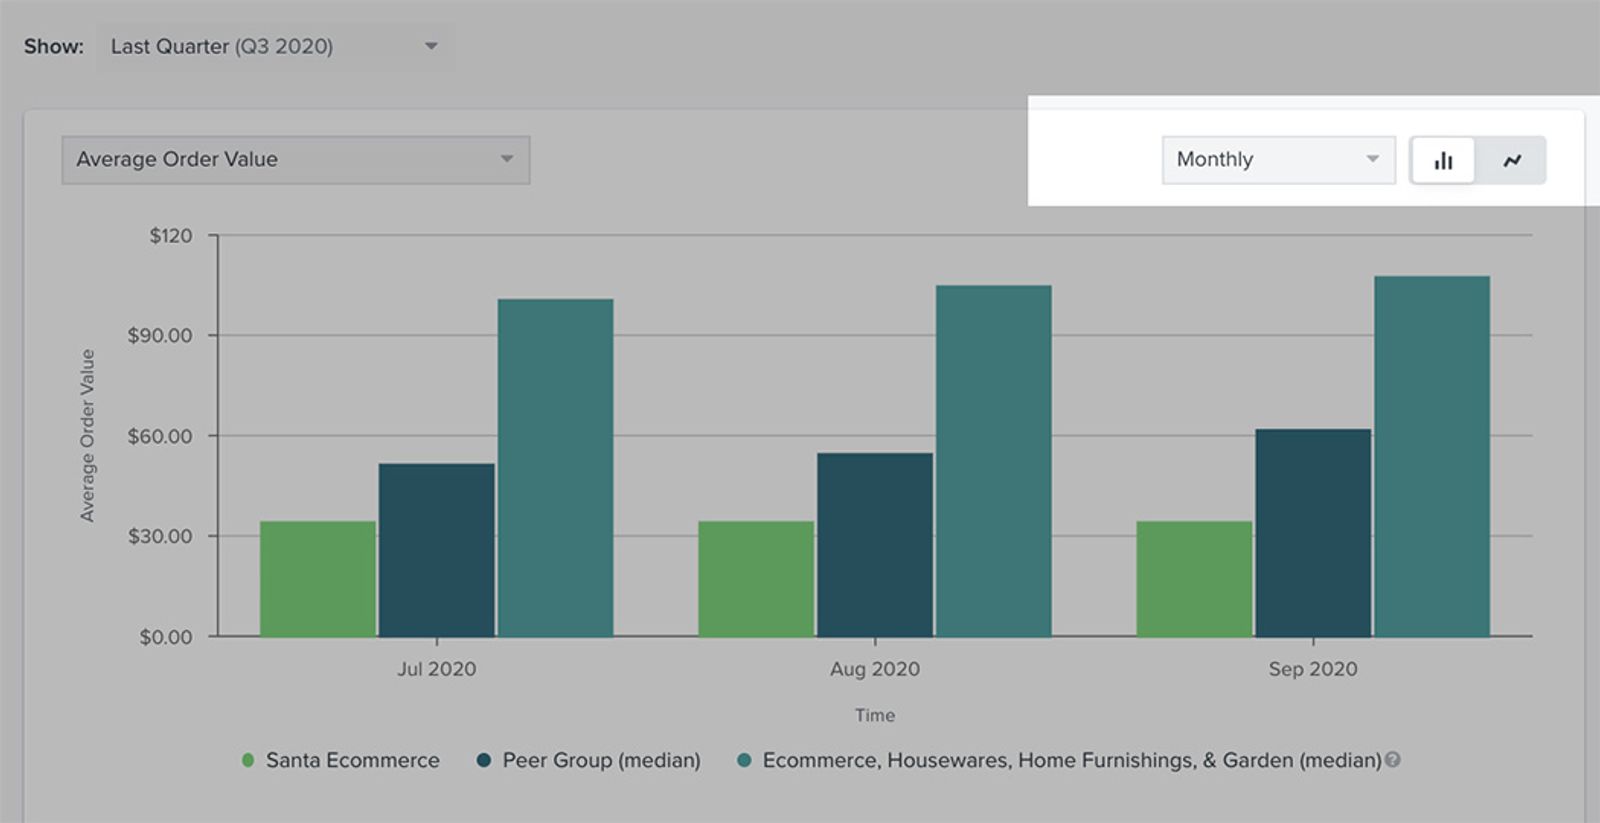
3. 다음으로 기간별 분류(예: 월별, 분기별, 연도별)를 선택하고, 두 개의 그래프 아이콘 중 하나를 선택해 새 그래프 형식을 고르세요. 표시되는 순서대로 두 아이콘 옵션은 막대 그래프와 선 그래프예요.
그래프 아래에는 비즈니스에서 어떤 영역을 잘하고 있고 어떤 영역이 개선이 필요한지 설명하는 표가 표시돼요. 이는 그래프에 설정한 기간에 따라 업데이트돼요. 여기에서는 본인 데이터와 동종업계 기업/업계 경쟁자 그룹의 정보만 표시되며, 업계 벤치마크는 그래프에만 표시돼요.

이메일 및 SMS 캠페인 성과 페이지 사용자 지정
이메일 캠페인 성과 및 SMS 캠페인 성과 페이지에서는 이메일 및 SMS 마케팅과 전송 가능성과 관련된 핵심 성과 지표를 세부적으로 보여줘요. 조회할 그래프, 이 그래프에서 집중할 성과 지표, 데이터 기간을 맞춤 설정할 수 있어요.
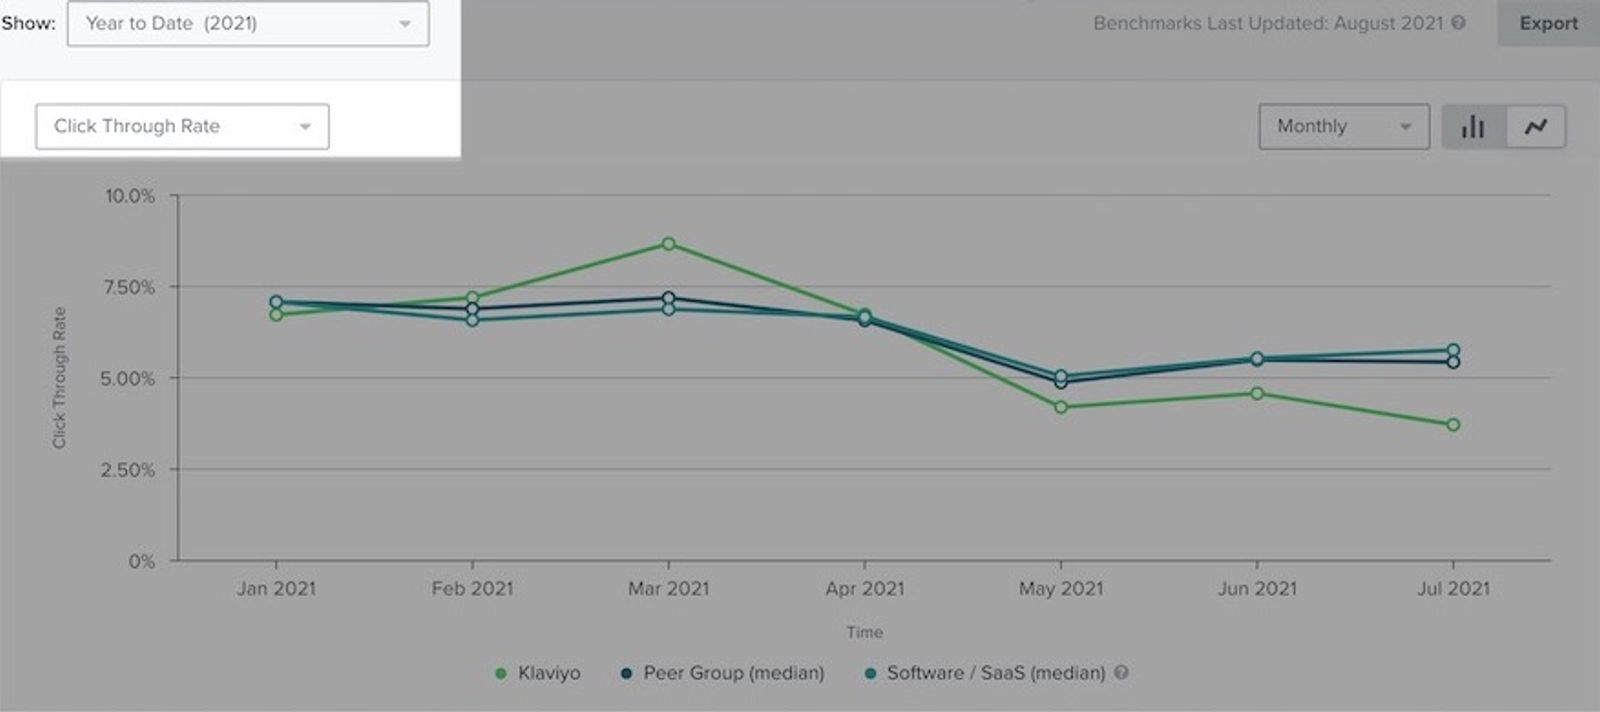
1. 보기를 맞춤 설정하려면 그래프 카드의 왼쪽 상단에서 표시옆의 드롭다운에서 원하는 데이터 기간을 선택하세요.
2. 아래 드롭다운에서 분석하려는 성과 지표(예: 이메일 열람률, 클릭률, 클릭률, 전환율, 수신자당 수익, 반송률, 스팸 신고율 또는 구독 취소율)를 선택하는 추가 옵션도 사용할 수 있어요.
다른 Klaviyo 보고서와 달리, 벤치마크 보고서에서는 평균 주문 수 숫자가 선택한 종료 날짜까지 합산돼요. 예를 들어 지난달의 평균 주문 수를 보고 있다면, 지난달 종료 시점까지의 총합이 될 거예요.
3. 이 페이지의 오른쪽 상단에서 기간별 분석 기준(예: 월별, 분기별 또는 연도별)을 선택하세요.
4. 두 그래프 아이콘 중 하나를 선택해 새 그래프 형식을 선택해요. 표시되는 순서대로 두 아이콘 옵션은 막대 그래프와 선 그래프예요.
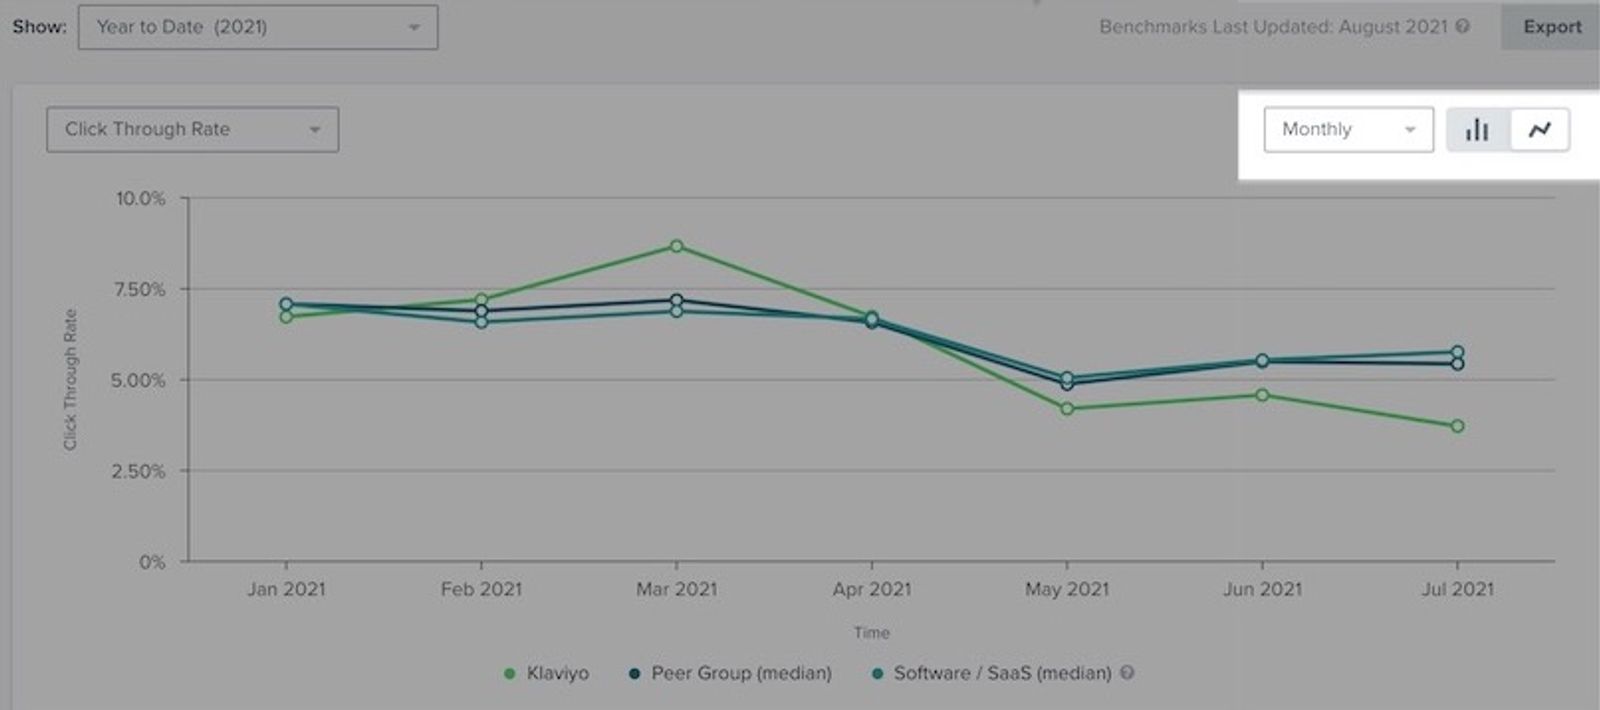
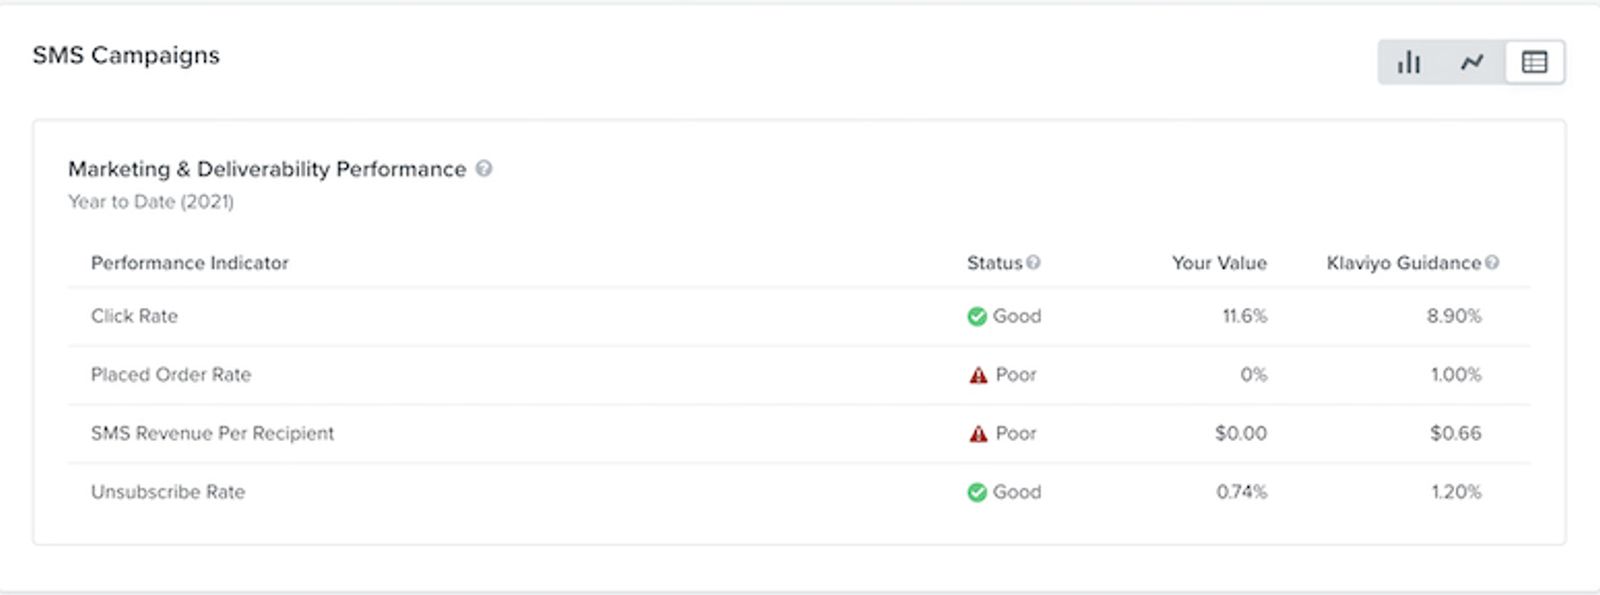
그래프 아래에는 표 2개가 표시돼요. 하나는 마케팅 성과를 요약하고, 다른 하나는 전송 가능성 성과를 보여줘요. 이는 그래프에 설정한 기간에 따라 업데이트돼요. 여기에서는 본인 데이터와 동종업계 기업/업계 경쟁자 그룹의 정보만 표시되며, 업계 벤치마크는 그래프에만 표시돼요.
플로우 성과 페이지를 사용자 지정하기
플로우 성과 페이지는 유사한 기업과 비교했을 때 시간 경과에 따른 성과 추세를 보여 주면서 플로우 데이터에 집중할 수 있도록 해요. 보고 싶은 그래프, 이 그래프에서 집중할 성과 지표, 데이터의 기간, 그리고 집중하고 있는 특정 플로우를 맞춤 설정할 수 있어요.
1. 시작하려면 표시 옆의 드롭다운 에서 데이터 기간을 선택하세요.
2. 기간 드롭다운 아래에서 그래프에서 중점적으로 볼 플로우와 특정 성과 지표(예: 이메일 열람률, 전환율, 클릭률, 주문율, 수신자당 수익, Spam Report Rate, 구독 취소율 또는 반송률)를 선택해 주세요.
다른 Klaviyo 보고서와 달리, 벤치마크 보고서에서는 평균 주문 수 숫자가 선택한 종료 날짜까지 합산돼요. 예를 들어 지난달의 평균 주문 수를 보고 있다면, 지난달 종료 시점까지의 총합이 될 거예요.
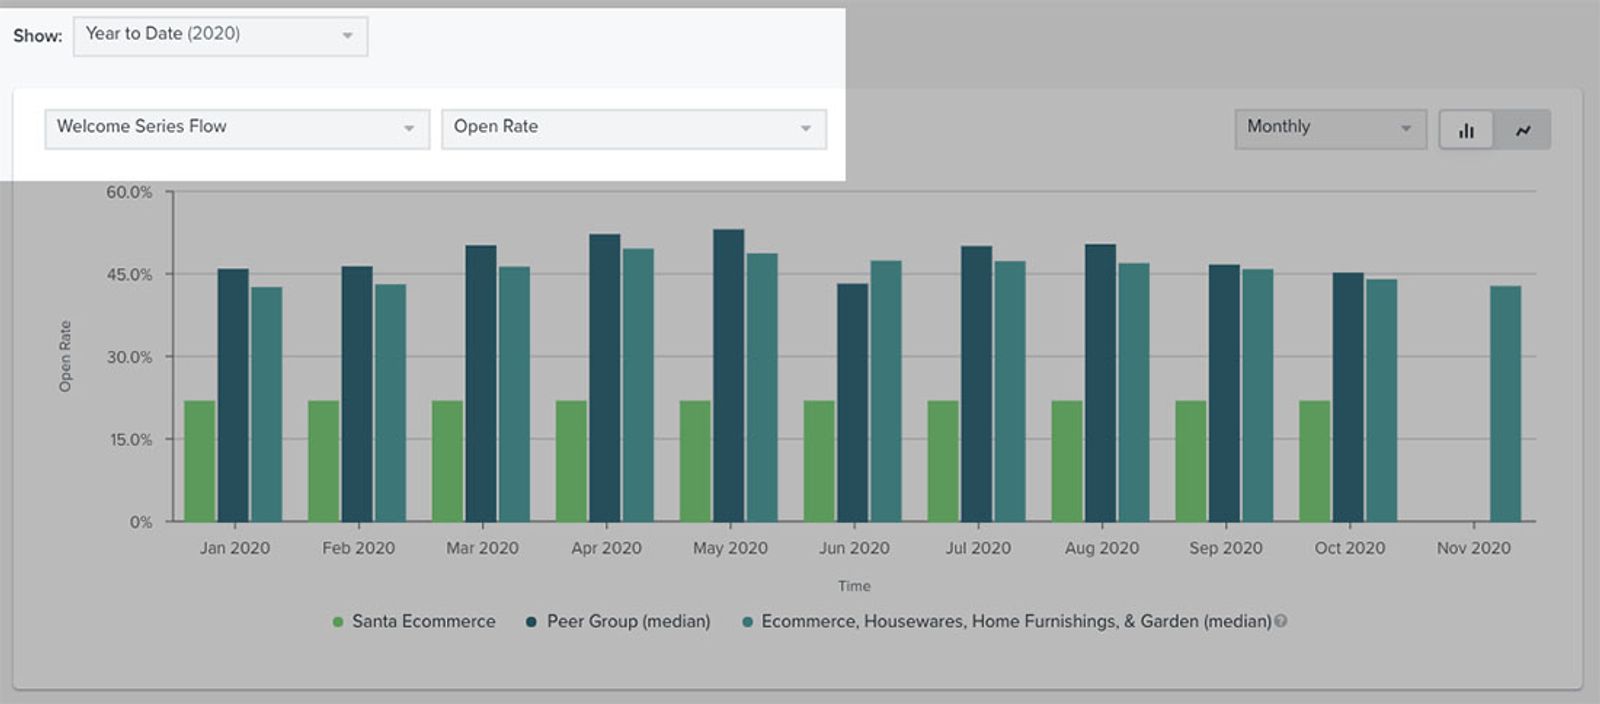
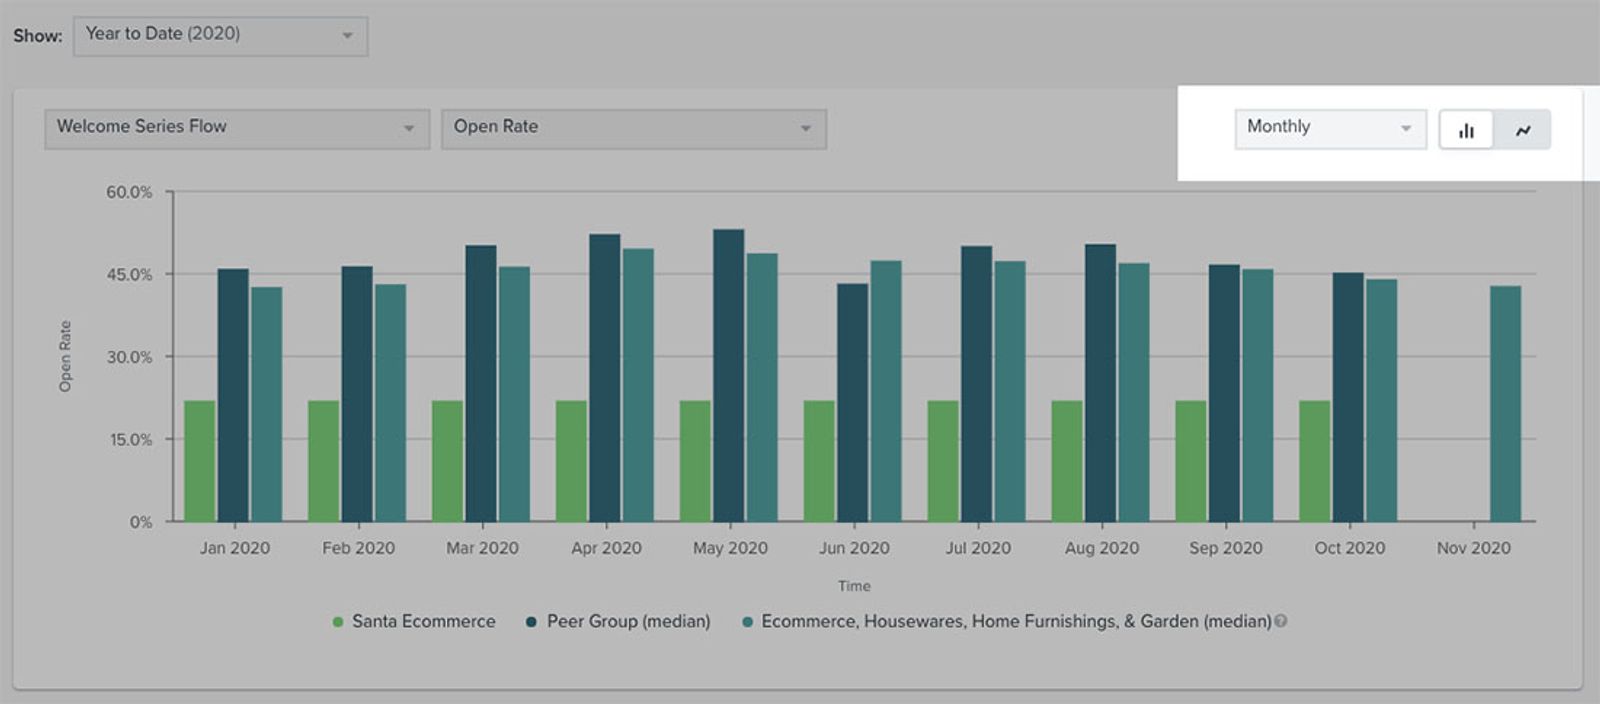
3. 기간 세분화를 선택해 주세요(예: 일별, 주별 또는 월별).
4. 두 그래프 아이콘 중 하나를 선택해 새 그래프 형식을 선택해요. 표시되는 순서대로 두 아이콘 옵션은 막대 그래프와 선 그래프예요.
그래프 아래에는 4개의 표가 표시돼요. 이 표는 그래프에 설정한 기간에 따라 업데이트돼요. 표 옵션은 다음 주요 플로우별로 제공돼요:
- 환영 이메일 시리즈
- '장바구니 이탈'
- 탐색 이탈
- 고객 감사 메시지
분석하려는 플로우에 따라 이 표를 숨기거나 펼칠 수 있어요. 여기에는 동종업계 기업/업계 경쟁자의 데이터만 표시되며, 업계 벤치마크는 그래프에만 표시돼요.
플로우를 변경하세요.
1. 플로우 성과 페이지에서 이러한 카테고리 중 어느 것에서든 선택한 플로우를 업데이트하려면 플로우 카드 오른쪽에서 플로우 변경을 선택하세요.
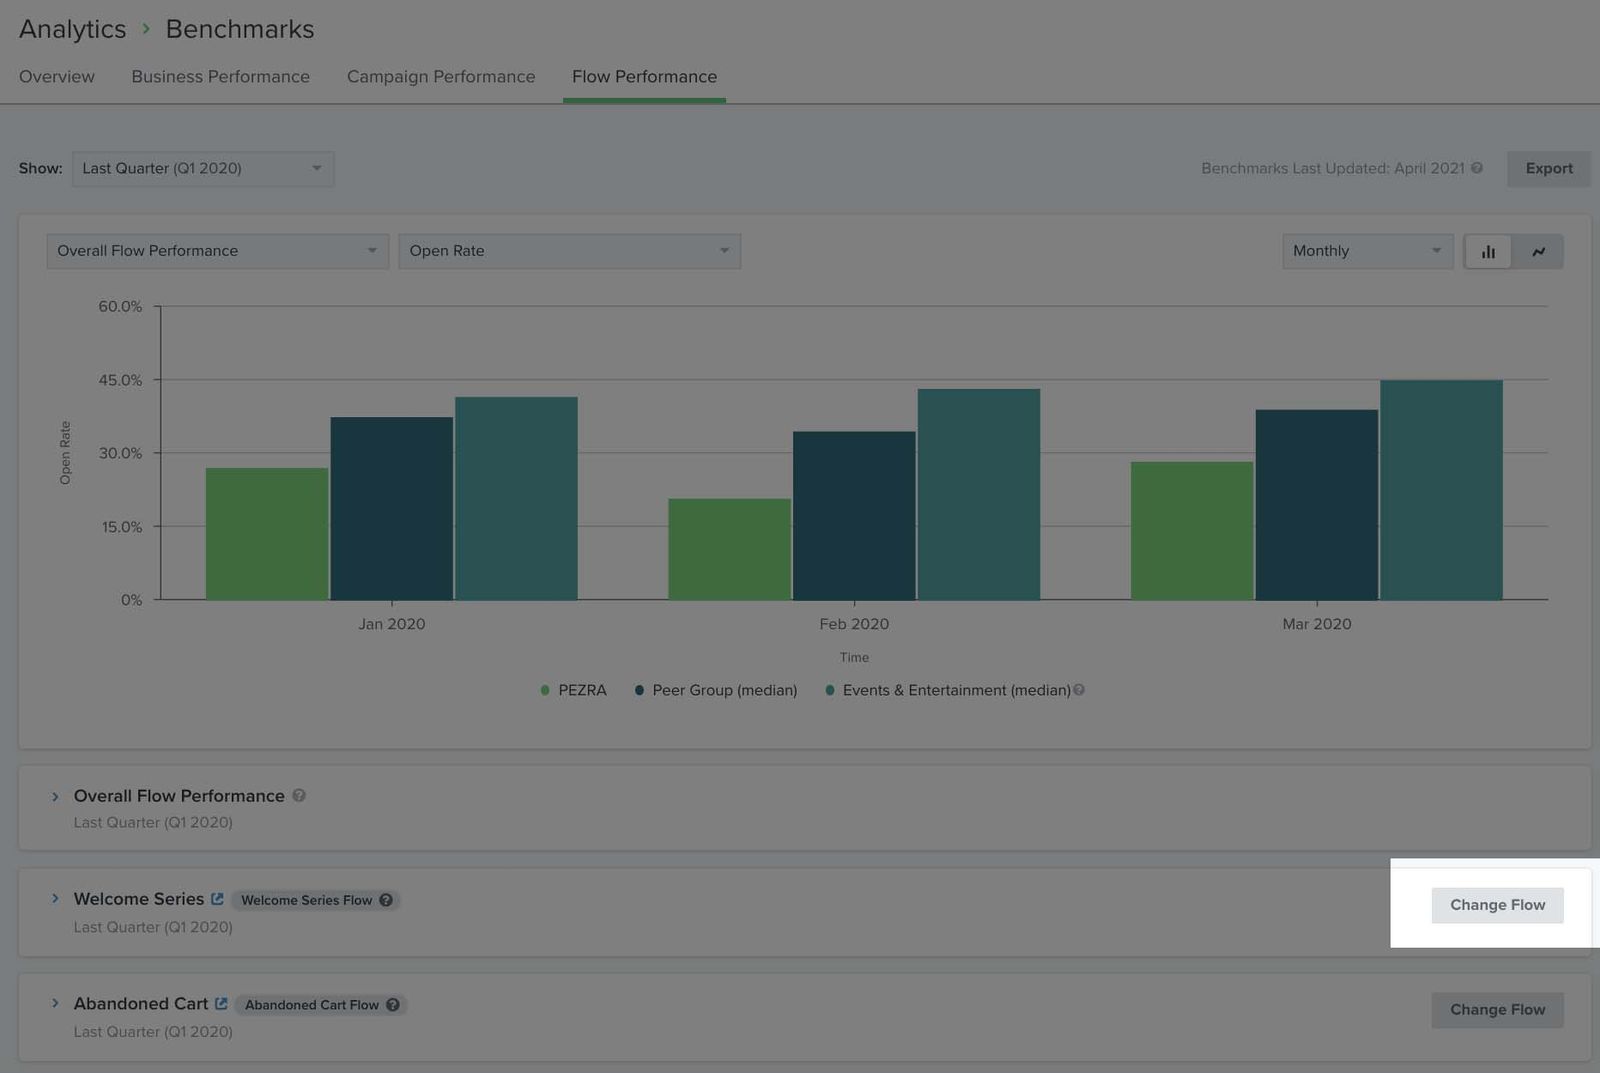
2. 표시되는 팝업에서 드롭다운 메뉴로 다른 플로우를 선택하고 플로우 선택 변경을 클릭합니다.
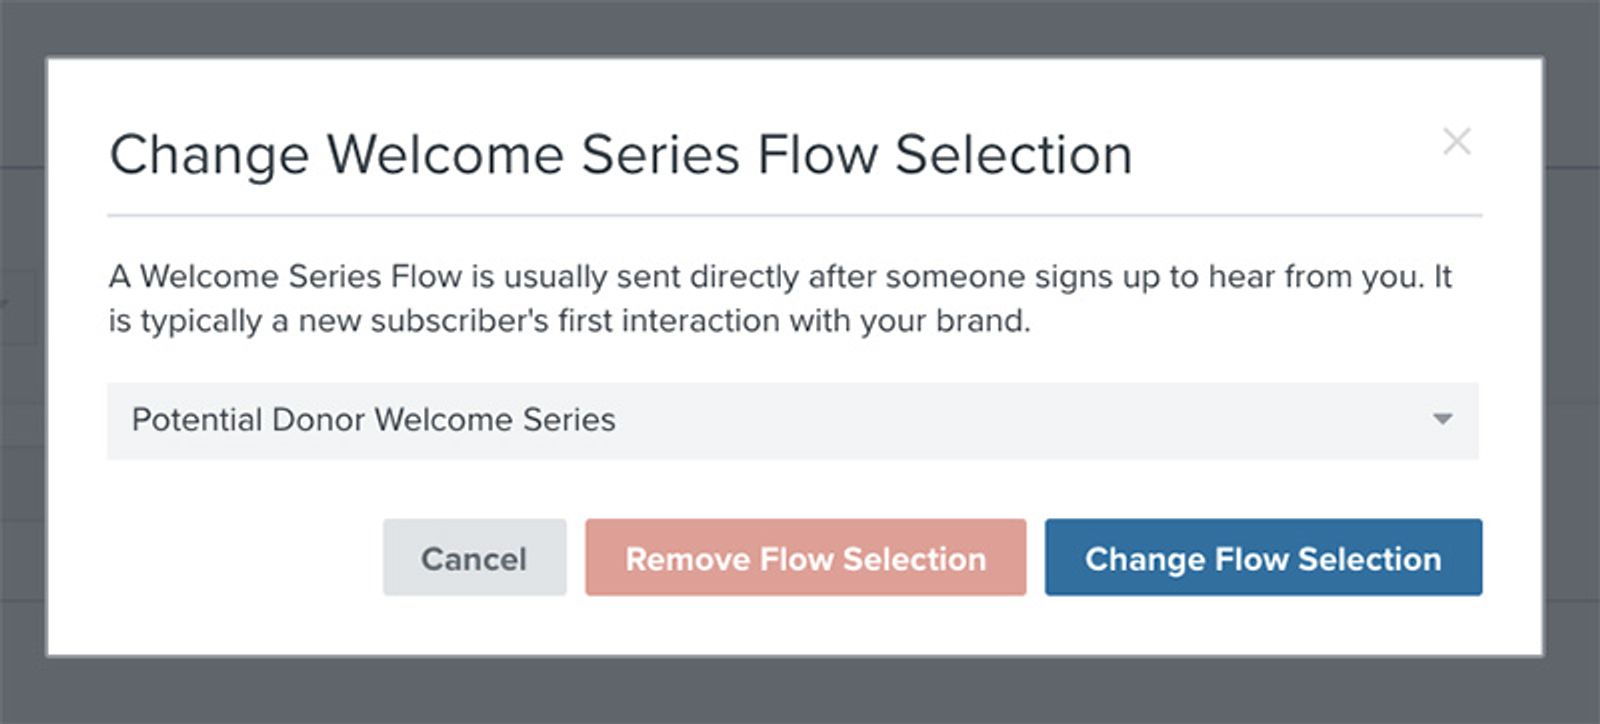
그러면 플로우가 업데이트되고, 새 데이터 채우기가 완료되면 알림을 받게 돼요. 여기에서는 동종업계 기업/업계 경쟁자의 데이터와 정보만 확인할 수 있으며 업계 벤치마크는 그래프에만 표시돼요.
추가 자료
- 벤치마크 보고서 시작하기
벤치마크를 통해 계정 데이터를 Klaviyo 모범 사례, 업계 동향, 그리고 내 업체와 유사한 기업과 비교하여 분석하는 방법을 알아보세요. 계정의 다양한 측면을 통해 성과를 확인하면 Klaviyo를 최대한 활용하기 위해 개선이 필요한 부분에 우선순위를 지정할 수 있습니다.
- 보고 시작하기
계정에서 사용할 수 있는 다양한 강력한 Klaviyo 보고 도구에 대해 알아보세요. Klaviyo는 데이터를 활용해 비즈니스를 성장시키고 대상과의 관계를 강화할 수 있도록 설계되었어요. 세분화 및 자동화 도구를 사용하면 채널 전반에서 커뮤니케이션 활동을 개인화하고 타겟팅하여 참여 유도를 높이고 비즈니스 성장을 촉진할 수 있어요. 하지만 비즈니스 전략과 마케팅 활동이 얼마나 효과적인지 이해하려면 시간이 지남에 따라 성과 추세를 측정하고 분석할 수 있는 적절한 보고가 필요해요.
- Klaviyo에서 맞춤 보고서 시작하기
Klaviyo 커스텀 보고를 사용해 각 마케팅 채널 및 개별 제품 또는 서비스 전반에서 비즈니스 상태를 모니터링하는 방법을 알아보세요. 이러한 보고를 사용하면 데이터를 활용해 고객 행동의 트렌드를 파악하고, 일관된 마케팅 전략을 중심으로 팀을 정렬하며, 새로운 인사이트에 따라 실행하면서 비즈니스를 성장시킬 수 있어요.Klaviyo 보고를 이제 막 시작하셨나요? 기능별 보고에 대해 자세히 알아보고 Klaviyo의 분석 도구에 대한 전반적인 개요를 확인하세요.