Measure Social Revenue and Engagement with Social Performance
Premium feature. Available on the paid Klaviyo Social Marketing plan with Facebook Login.
Social Performance allows you to measure the impact of your social media campaigns by attributing revenue back to actions Klaviyo profiles take on social and providing overall trend analysis on social engagement.
Available reports
The reports below all can be adjusted by the Time period filter at the top of the Social Performance page where you can select the time period and comparison period you would like to analyze.
Overview
Social Revenue is the total revenue attributed to social. This shows all the revenue attributed to profiles who submitted an auto-reply or engaged with your brand on social.
- You can change the lookback window. This allows you to select how long after a comment, DM, or share a purchase should count toward Social revenue. This only applies to customers with a known social handle and an email address or phone number.
- You can also choose which conversion events apply to that window using the conversion event dropdown. The dropdown is configurable and includes the conversion events Klaviyo creates by default, along with any custom events you have added to your Klaviyo account.
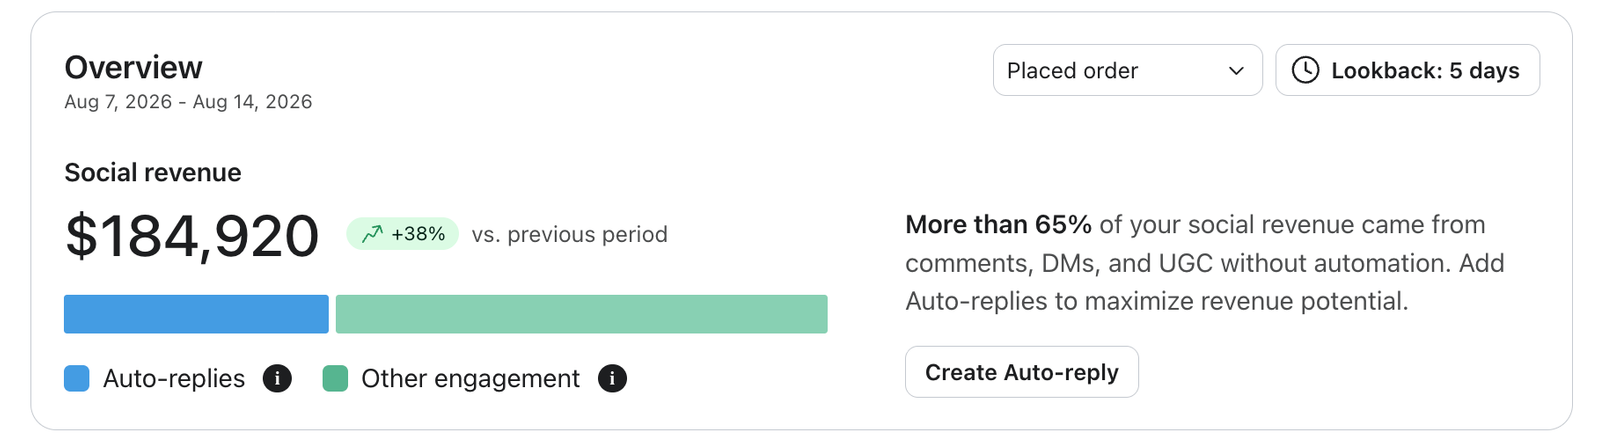
Social Revenue is not associated with the broader Klaviyo Attributed Revenue (KAV). It is a separate metric and does not de-duplicate revenue attribution from KAV instead it is meant to estimate the impact of social on your bottom line.
Engagement at a Glance
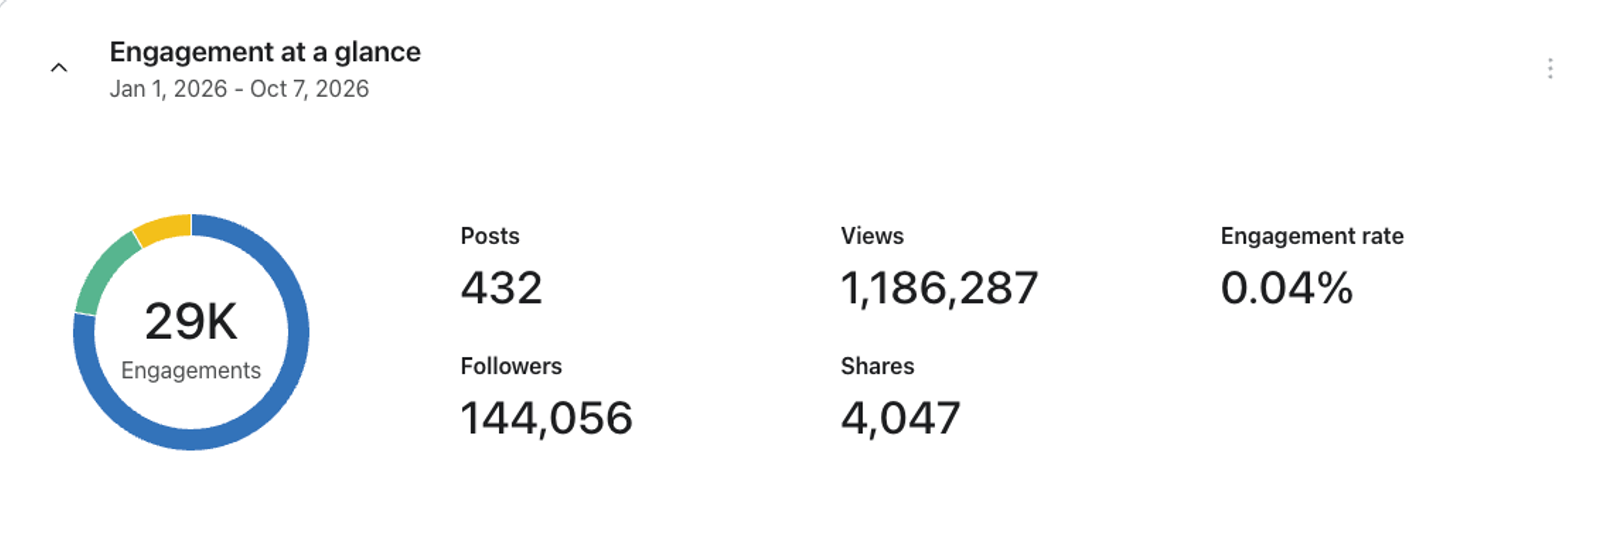
See your brand's top-level performance in one dashboard. We pull in total posts, views, shares, followers, engagements, and engagement rate so you can quickly understand how your brand is doing. Trend comparisons against the previous period show whether you're improving over time, and in which metrics.
Top Performing Content
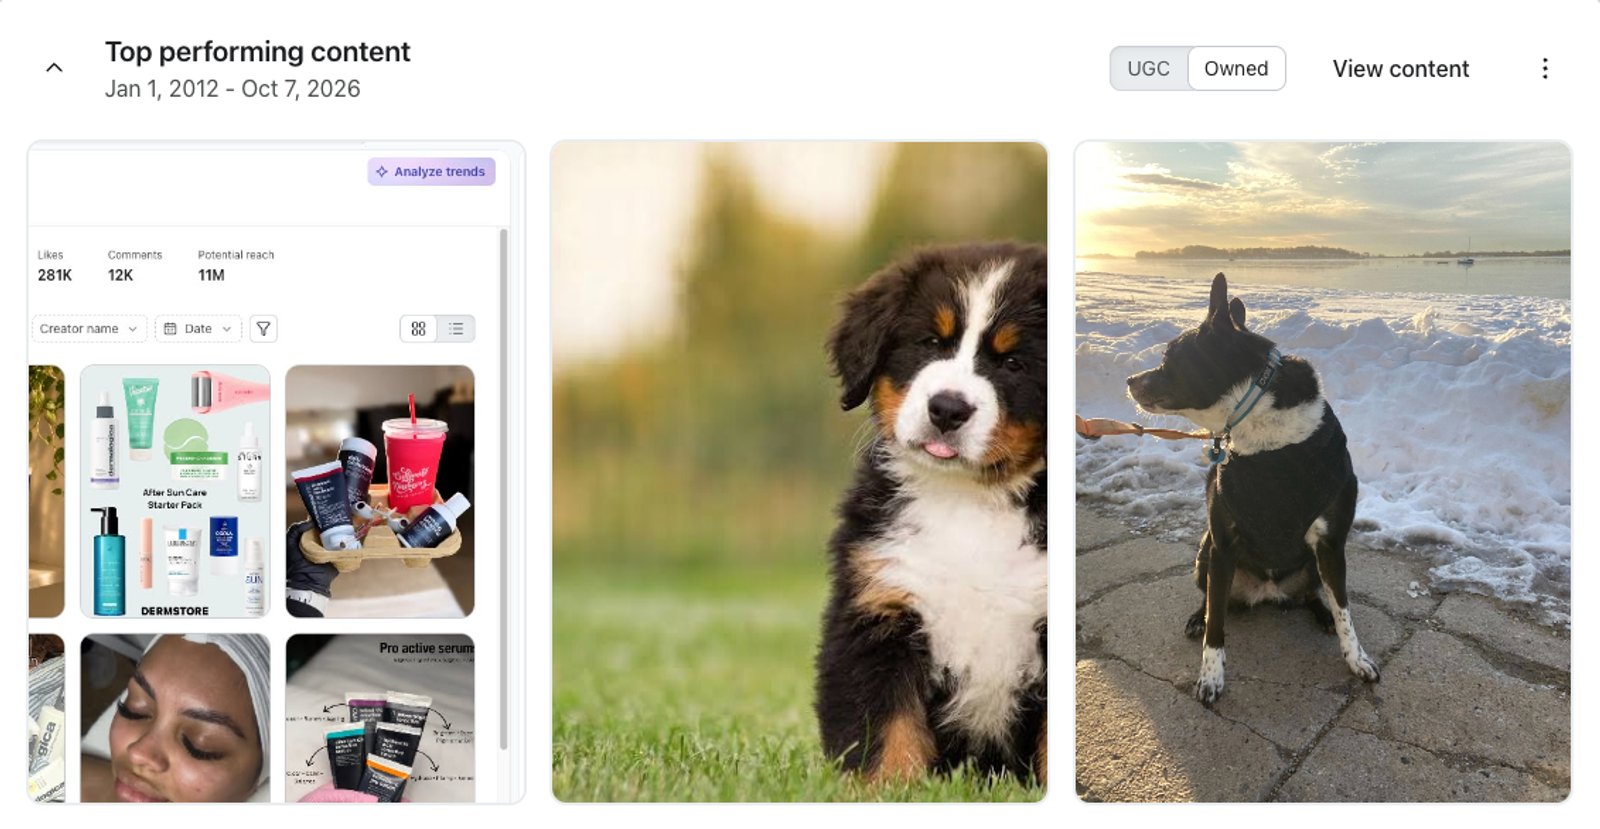
This report ranks posts by engagement. A post's engagement is the sum of its available engagement events (likes, comments, saves, and shares), based on what each platform currently returns.
Toggle between user-generated content (UGC) and your brand's owned content. Click any post to open a side drawer with more detail.
Engagement over Time
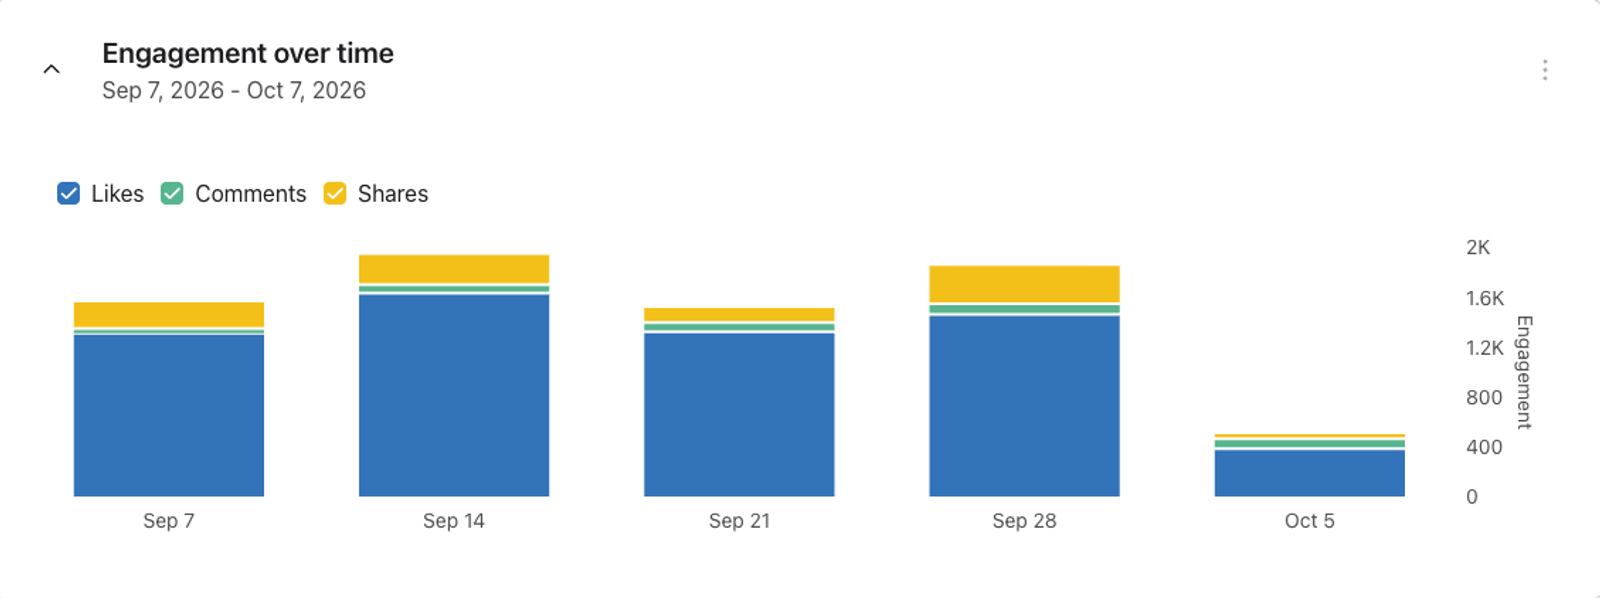
This report shows your engagement metric breakdown by likes, shares, and comments across your brand’s own posts. You can drill down to look at just one, two, or all three of the key engagement metrics we track.
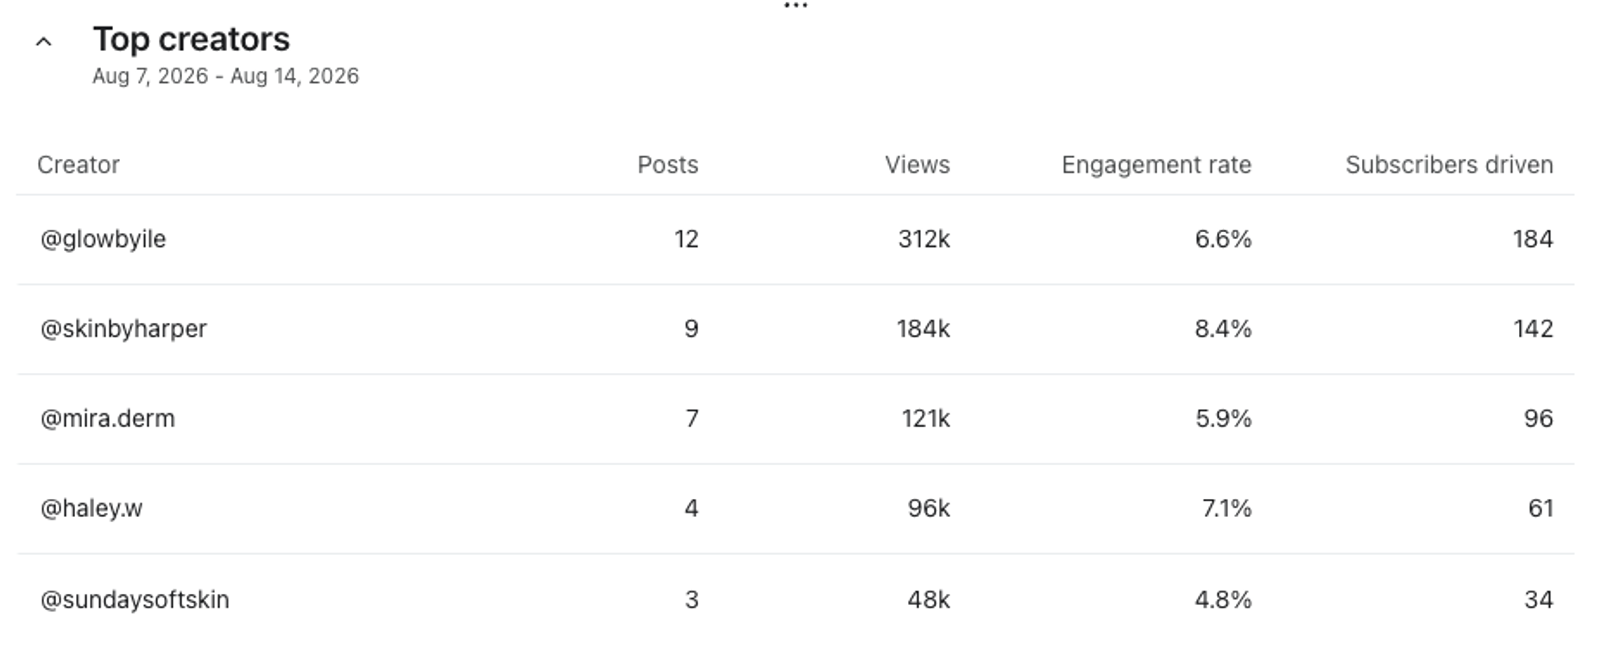
Top Creators
This report surfaces the creators who have tagged your brand the most, along with engagement per post and follower count. You can adjust the ordering by brand mentions, engagement per post, or follower count.
Subscriber Growth
This report shows the count of profiles whose subscription came through social, over time. A profile counts as social-sourced when its email, SMS, or WhatsApp subscribe method is a social method, such as SOCIAL_INSTAGRAM_MESSAGE. The report is based on subscribe method, not profile origin.
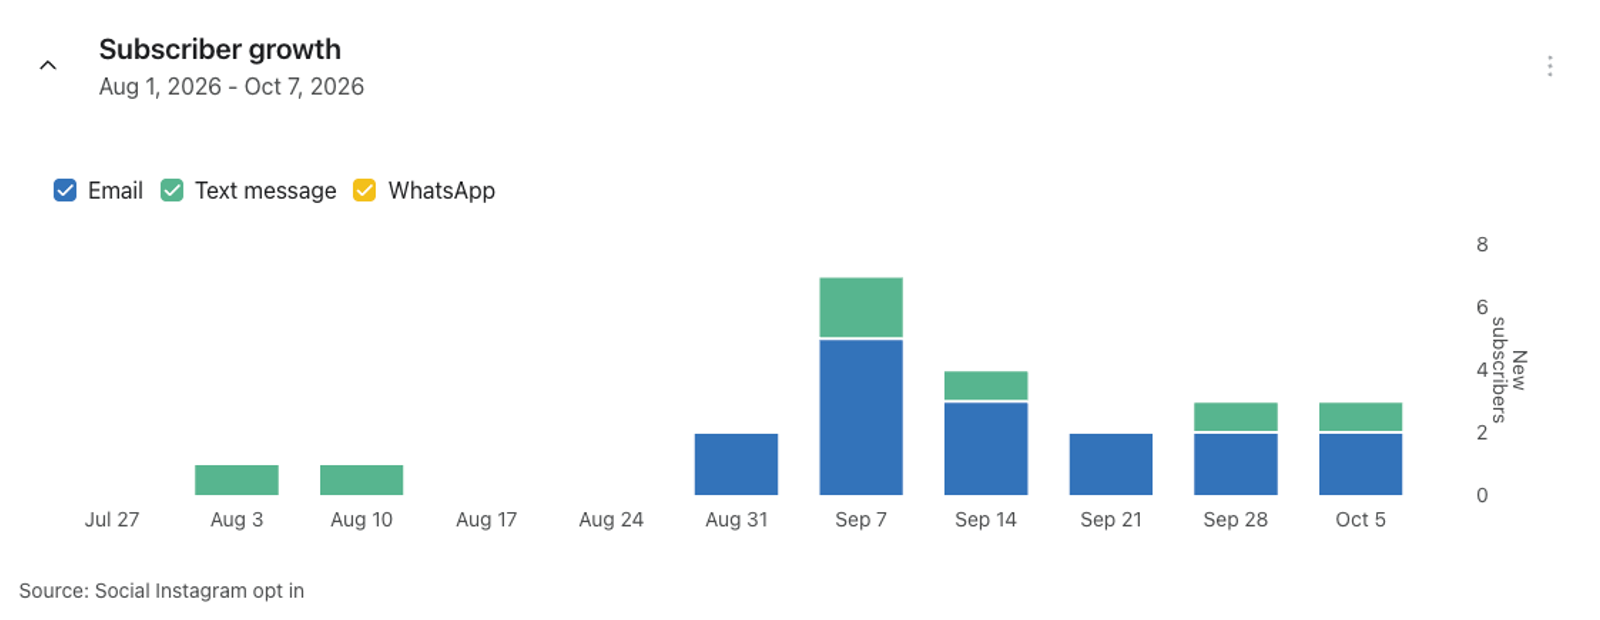
Note: This report counts profiles that subscribed through social, including existing profiles that later opted in through social. It is not a count of net-new profiles. For example, if a profile subscribed to email through a form and later subscribed a phone number through an auto-reply, the phone number is counted.