Getting started with custom monitors
You will learn
Learn about custom monitors in Klaviyo. With custom monitors, you can configure alerts to quickly identify and resolve issues around key metrics and objects in Klaviyo (i.e., segments and flows). Additionally, see our recommended use cases to quickly get set up with monitors to stay ahead of issues and discover trends.
Advanced KDP is not included in Klaviyo’s standard marketing application, and a subscription is required to access the associated functionality. Head to our billing guide to learn how to purchase this plans.
Before you begin
In addition to custom monitors, Advanced KDP customers will also see the auto-monitors feature on the Monitors page. Klaviyo’s auto-monitors automatically monitor your account performance for anomalies with key objects such as flows and campaigns.
Head to our guide on Klaviyo’s auto-monitors to learn more about the functionality.
Create custom monitors
- To create custom monitors in Klaviyo, navigate to Advanced KDP > Data management > Monitors.
- Select Create custom monitor or select a monitor type (i.e., Single flow) to begin the process.
If there are no previously created monitors, you will see a notice indicating you have none setup, along with the Create custom monitor button. If you already have monitors setup, the Create custom monitor button will appear at the top of the page.
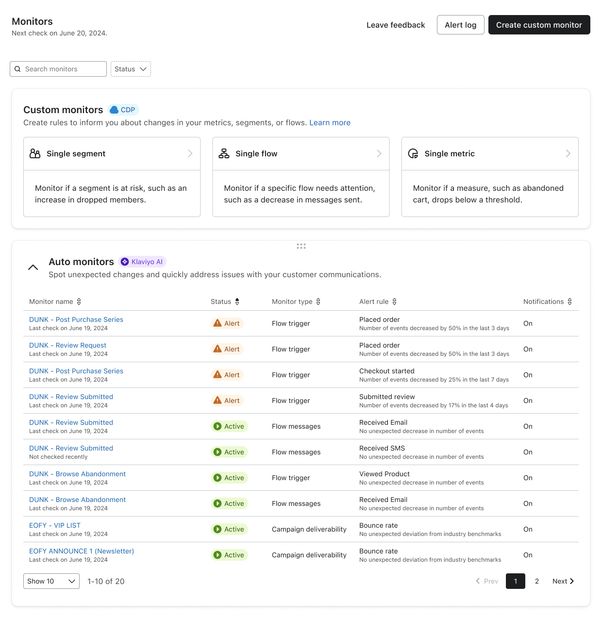
There are 3 types of custom monitors you can set up in Klaviyo:
- Single flow monitor
A flow to monitor key performance metrics for and receive alerts about. - Single metric monitor
An event to monitor and receive alerts about. - Single segment monitor
A segment to monitor and receive alerts about.
After selecting the Create monitor button, there are 3 sets of information you need to configure to set up your custom monitor. The directions below walk through these sections in more detail.
Monitor details
On the Monitor details section, you will enter information regarding the naming, type, and setup of the monitor itself.
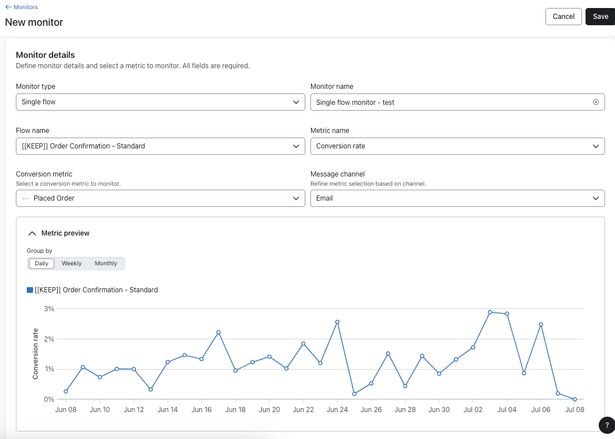
Monitor type
Set the type of monitor (i.e., single flow, single metric, single segment).
Monitor name
Set a name for the custom monitor.
Object name
Set the flow, metric, or segment that you will monitor. Based on the monitor type, you will see either a list of available metrics, segments, or active flows with at least 1 message.
Metric name
Set the specific performance metric that you will monitor for the object. For the Single metric monitor type, you can only select the Total number (i.e., the count of the metric).
For the Single segment monitor type, you can select:
- Total members
- Added members
- Dropped members
For the Single flow monitor type, the following metrics are available:
- Open rate
- Click to open rate
- Bounce rate
- Spam complaint rate
- Click rate
- Conversion rate
- Unsubscribe rate
- Total recipients
- Total conversions
- Total delivered
Conversion metric
If you selected Conversion rate or Total Conversions as a metric, there will be an additional drop-down list with available conversion metrics.
Message channel
Set the message channel that you will monitor (i.e., email or SMS). Based on the metric being analyzed, you’ll see the available monitorable message channels.
For the following metrics, only email can be monitored:
- Open rate
- Click to open rate
- Bounce rate
- Spam complaint rate
For the following metrics, either email or SMS can be monitored:
- Click rate
- Conversion rate
- Delivery rate
- Unsubscribe rate
For the following metrics, you can select between email, SMS, or both channels to be monitored:
- Total recipients
- Total conversions
- Total delivered
You'll also see a metric preview that can be expanded to see selected metric performance on a daily, weekly, monthly basis.

Alert rule
In the Alert rule section, define the rules that will trigger alerts. Enter information related to when and what will trigger the alert.

Relationship
The operator between your actual performance and an expected value you set. You can select threshold operators (e.g., is less than, is more than, is equal to, etc.) or comparison operators (e.g., relatively increased by, absolutely increased by, etc.).
Relative vs absolute comparison operators
The comparison operators in the alert rule builder can be set to compare changes in a value based on a relative or absolute basis.
When using the relative basis comparison, it will measure the percent change from the original value. Choosing the absolute comparison operators will measure the change based on the numeric increase or decrease from the original value.
For example, say you have the following relative condition:
Alert when open rate relatively increases by more than 10% in the last 3 days compared to the previous 3 days.

If the open rate during the previous 3-day period was 20%, for this condition to be satisfied, the open rate would need to increase by a relative 10% (i.e., a multiplier of 1.1x) to 22%.
Relative increases and decreases are evaluated as a percent change from the previous period, even if the metric being evaluated is expressed as a rate (e.g., open rate or click rate).
Meanwhile, if you set the condition to absolute, it would look like the example setup below.
Alert when open rate is absolutely increased by more than 10% in the last 3 days compared to the previous 3 days

If the open rate during the previous 3 day period was 20%, for this condition to be satisfied the open rate would need to increase by an absolute 10% (i.e., an increase of 10%) to 30%.
Value
The value that your performance will be compared to.
If your selected metric is a rate this value is expressed as a percentage and must be between 0 and 100.
Time period
The time period to be monitored (e.g., previous day, last 7 days).
And/Or connectors
You can combine multiple conditions with And/Or operators. For alerts to be sent when both conditions are met, use And. For alerts to be sent when one condition is met, use Or.
You can have a maximum of 2 conditions in an alert rule.
Notifications
In the Notifications section, you can configure the channels through which custom monitor notifications are sent. Switch the toggle to On if you want notifications for this custom monitor to be sent to your home page in Klaviyo when triggered.
By default, the Owner, Admin, Manager, and Analyst user roles will receive notifications on Klaviyo’s home page.
You can configure email alerts as well by selecting the Add channel button. Email alerts are sent daily in the morning and 1 email will contain information about all your custom alerts.
For email alerts, you can select the user roles that will receive notifications as well.
Email notifications will only be sent for Flow trigger and Campaign deliverability monitor types.

Once your custom monitor is successfully created, it will first be checked during the next monitoring cycle (i.e., around 2am local time). Custom monitors are evaluated every 24 hours.
Monitor alerts
On the main Monitors page, you can see a list of your existing custom monitors, and an alert log.
Monitors list
On the Monitors list tab, you’ll see a list view of your existing custom monitors. Next to each custom monitor, you’ll see the following information:
- Monitor name
The name of the custom monitor. - Status
The status of the custom monitor. These can be:- Active
The custom monitor is enabled and an alert was not triggered during the previous check. - Alert
The custom monitor is enabled and the alert was triggered during the previous check. The next check will be in 24 hours. - Disabled
The monitor is not currently enabled.
- Active
- Alert rule
A preview of the alert rule set for the associated custom monitor. - Monitor type
The monitor type itself (i.e., single flow, single metric, single segment). - Notifications
Whether notifications are on or off for the custom monitor. - Last run
The last time the custom monitor was checked.
If you expand a custom monitor on the list, you’ll also be able to see:
- The object that is being monitored.
- The last time an alert triggered.
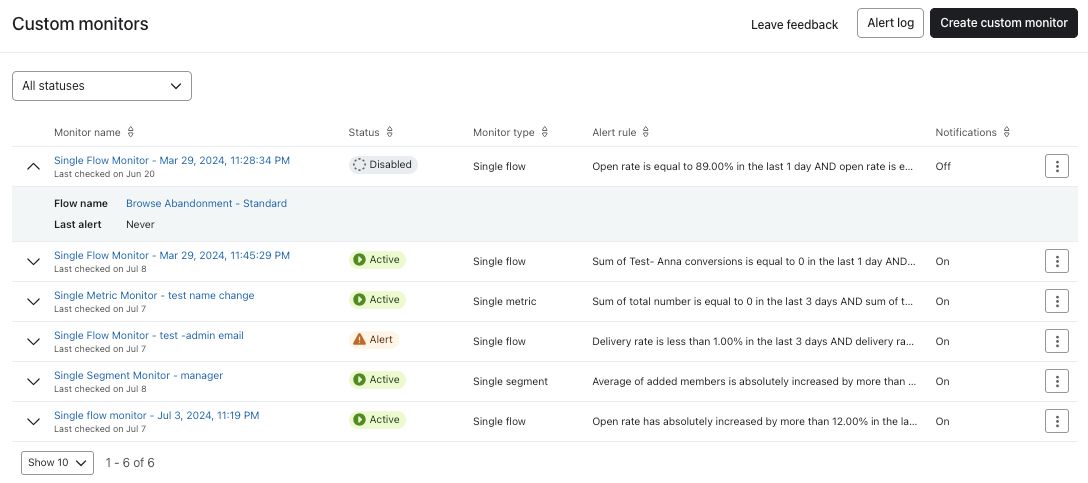
You can select the 3 dot menu next to a custom monitor to delete, disable, or edit it.
Alert log
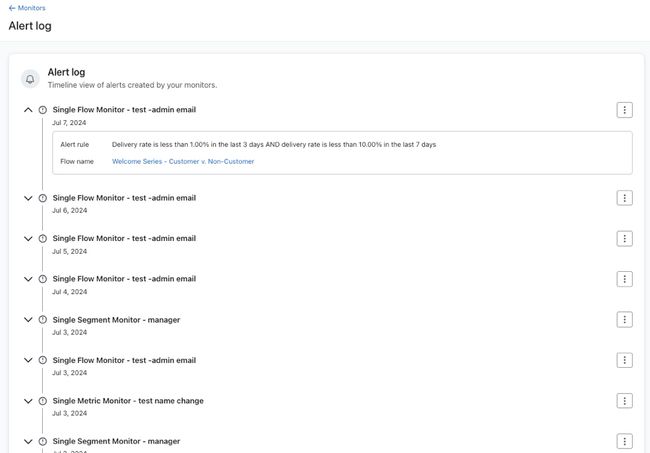
On the Alert log tab, you can see a timeline of the alerts that were triggered for your custom monitors. If you expand an event on the alert log timeline, you can see more information about the alert, including:
- The object that experienced the alert
- The associated metric
- The rule that was broken resulting in the alert
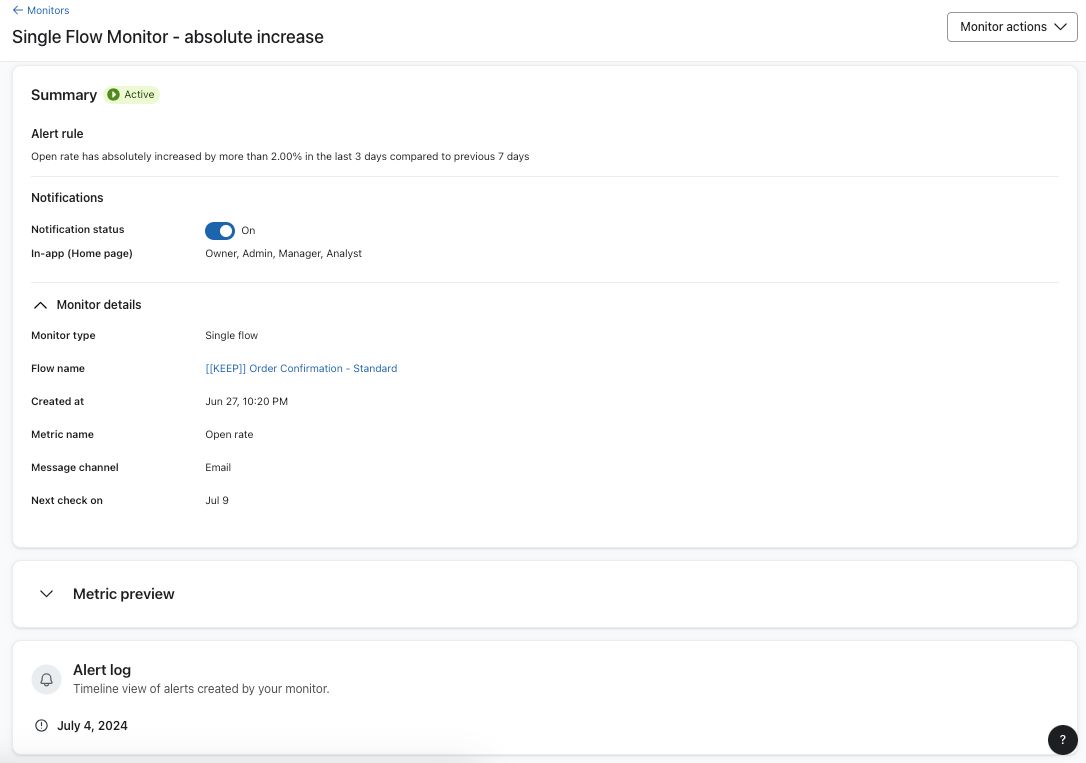
Monitor summary
If you click into a custom monitor on the Monitors list tab, you will be brought to the Monitor summary, where you can find more information about the monitor. You’ll see:
- Description of key information
A summary of the key details of the monitor. - Metric preview
A preview of the metric over time that can be grouped by day, week, or month. - Activity log
A timeline of the most recent alerts created by your monitor.
Recommended use cases for custom monitors
Monitor site visitors
With a Single metric monitor you can proactively monitor the number of Active on Site events captured in Klaviyo, and receive alerts if there is a drop in website traffic.
Below is an example of a custom monitor you can set up for the Active on Site event. Once you set the Monitor type and Metric name, you can use the Metric preview to see the daily, weekly or monthly numbers of Active on Site events to use as a benchmark for the values in the alert rules.
For the alert rule, create the following 2 conditions, as shown in the example below:
- Alert when Sum of Total number of Active on Site is less than 9300 in the last 7 days
Or
- Alert when Average of Total number of Active on Site is relatively decreased by more than 15 in the last 30 days compared to Average of previous 30 days.
Use values that match the volume of Active on Site events in your account based on the metric preview.
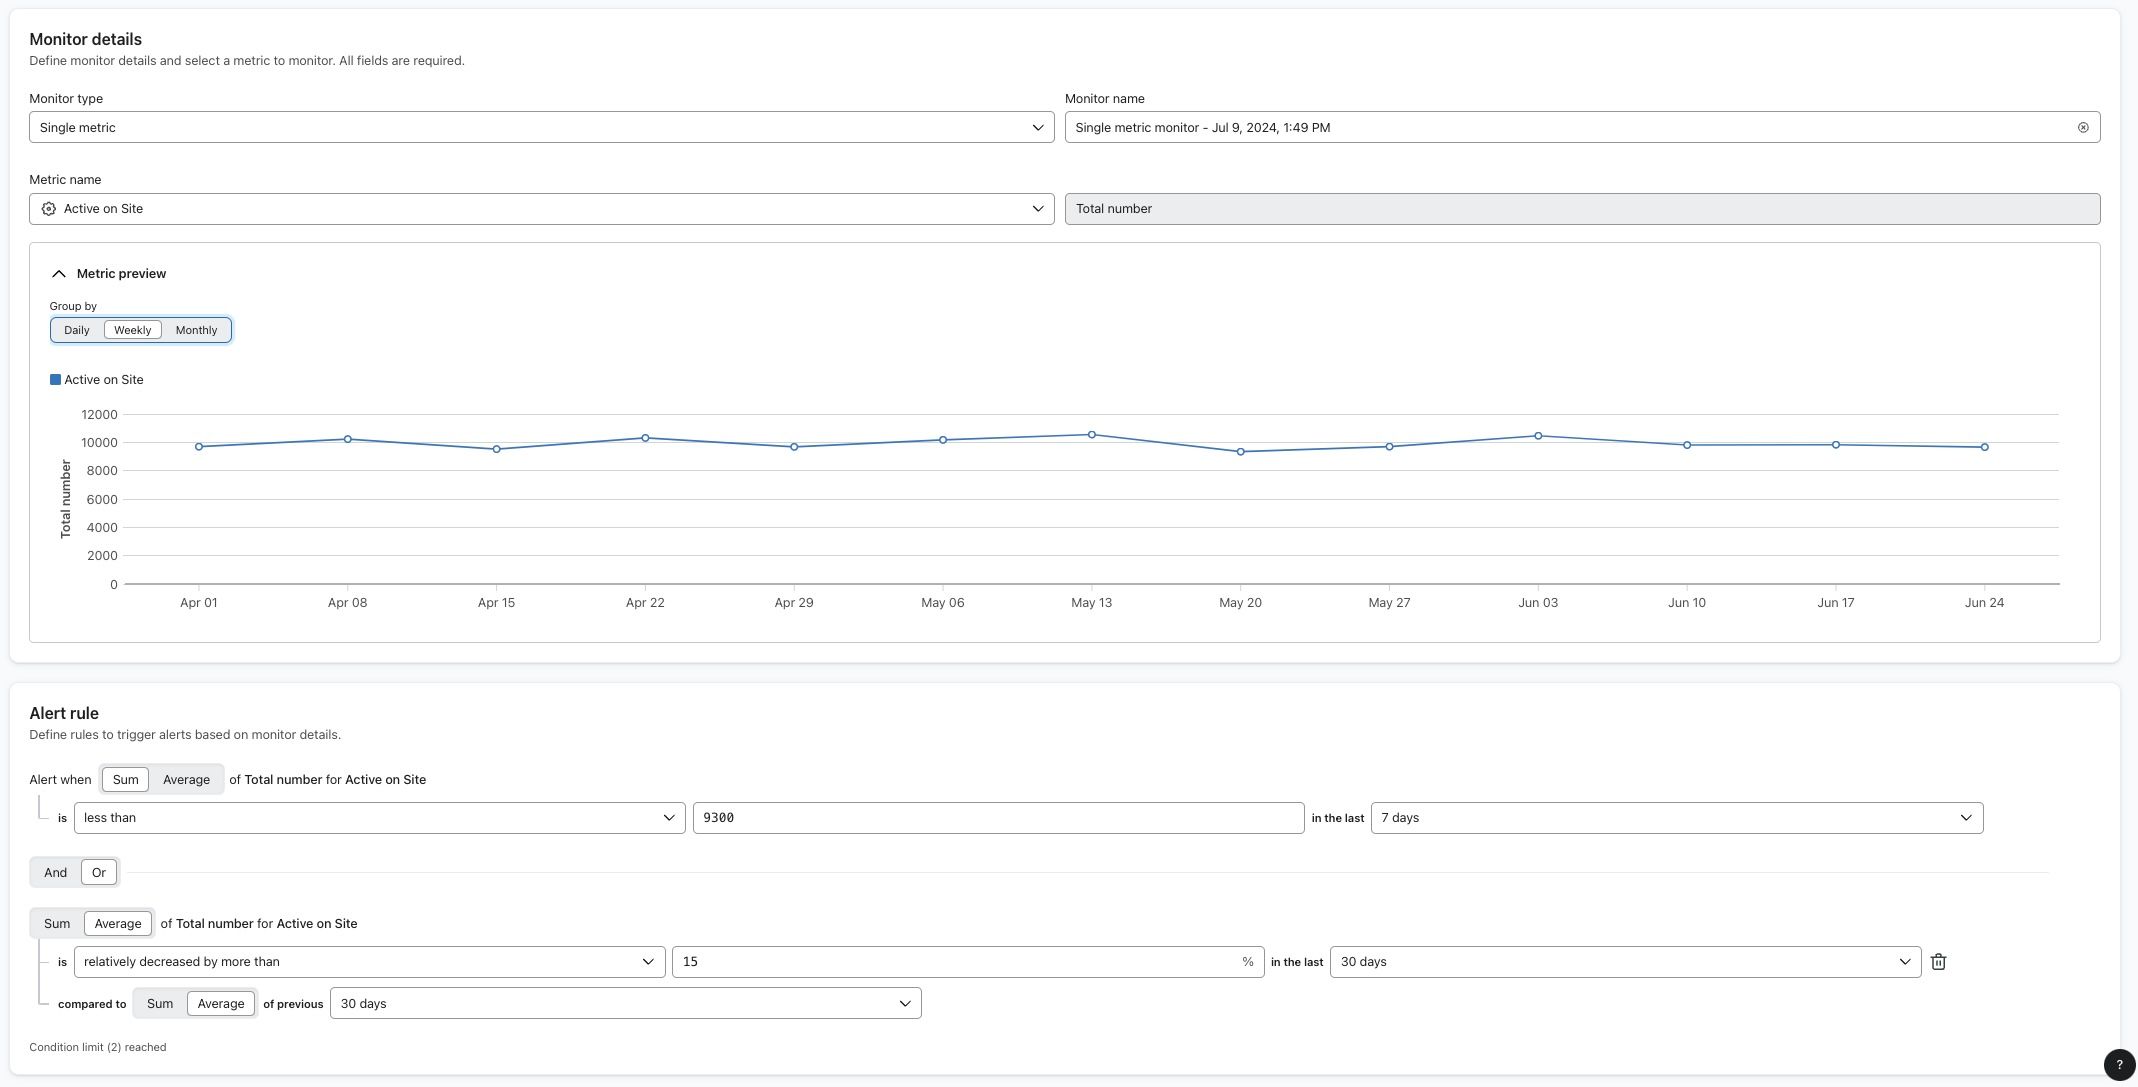
This first condition in this monitor calculates the number of Active on Site events during the last 7 days and compares it to a threshold of 9300. If the number drops below this threshold, an alert triggers.
The second condition in this alert calculates the average number of Active on Site events in the last 30 days and compares it to the average for the prior 30 days. If the difference is more than 15%, an alert triggers.
Monitor unsubscribe rates for a flow
With a Single flow monitor, you can create a monitor that proactively monitors the unsubscribe rate for key flows on your account. This is a great way to easily identify issues with unsubscribe rates in your flows so you can resolve them before your deliverability is impacted.
You can select any flow on your account, along with the channel you want to monitor (i.e., email or SMS unsubscribe rates). Once you set the Monitor type and Metric name, you can use the Metric preview to see daily, weekly or monthly unsubscribe rates to use as a benchmark for values in the alert rules.
For the alert rule, create the following 2 conditions, as shown in the example below:
- Alert when Unsubscribe rate for [flow] is greater than 0.5 in the last 7 days
OR
- Alert when Unsubscribe rate for [flow] is absolutely increased by more than 0.2 in the last 1 day compared to the previous 1 day
Use values that match the unsubscribe rates for your flow based on the metric preview.
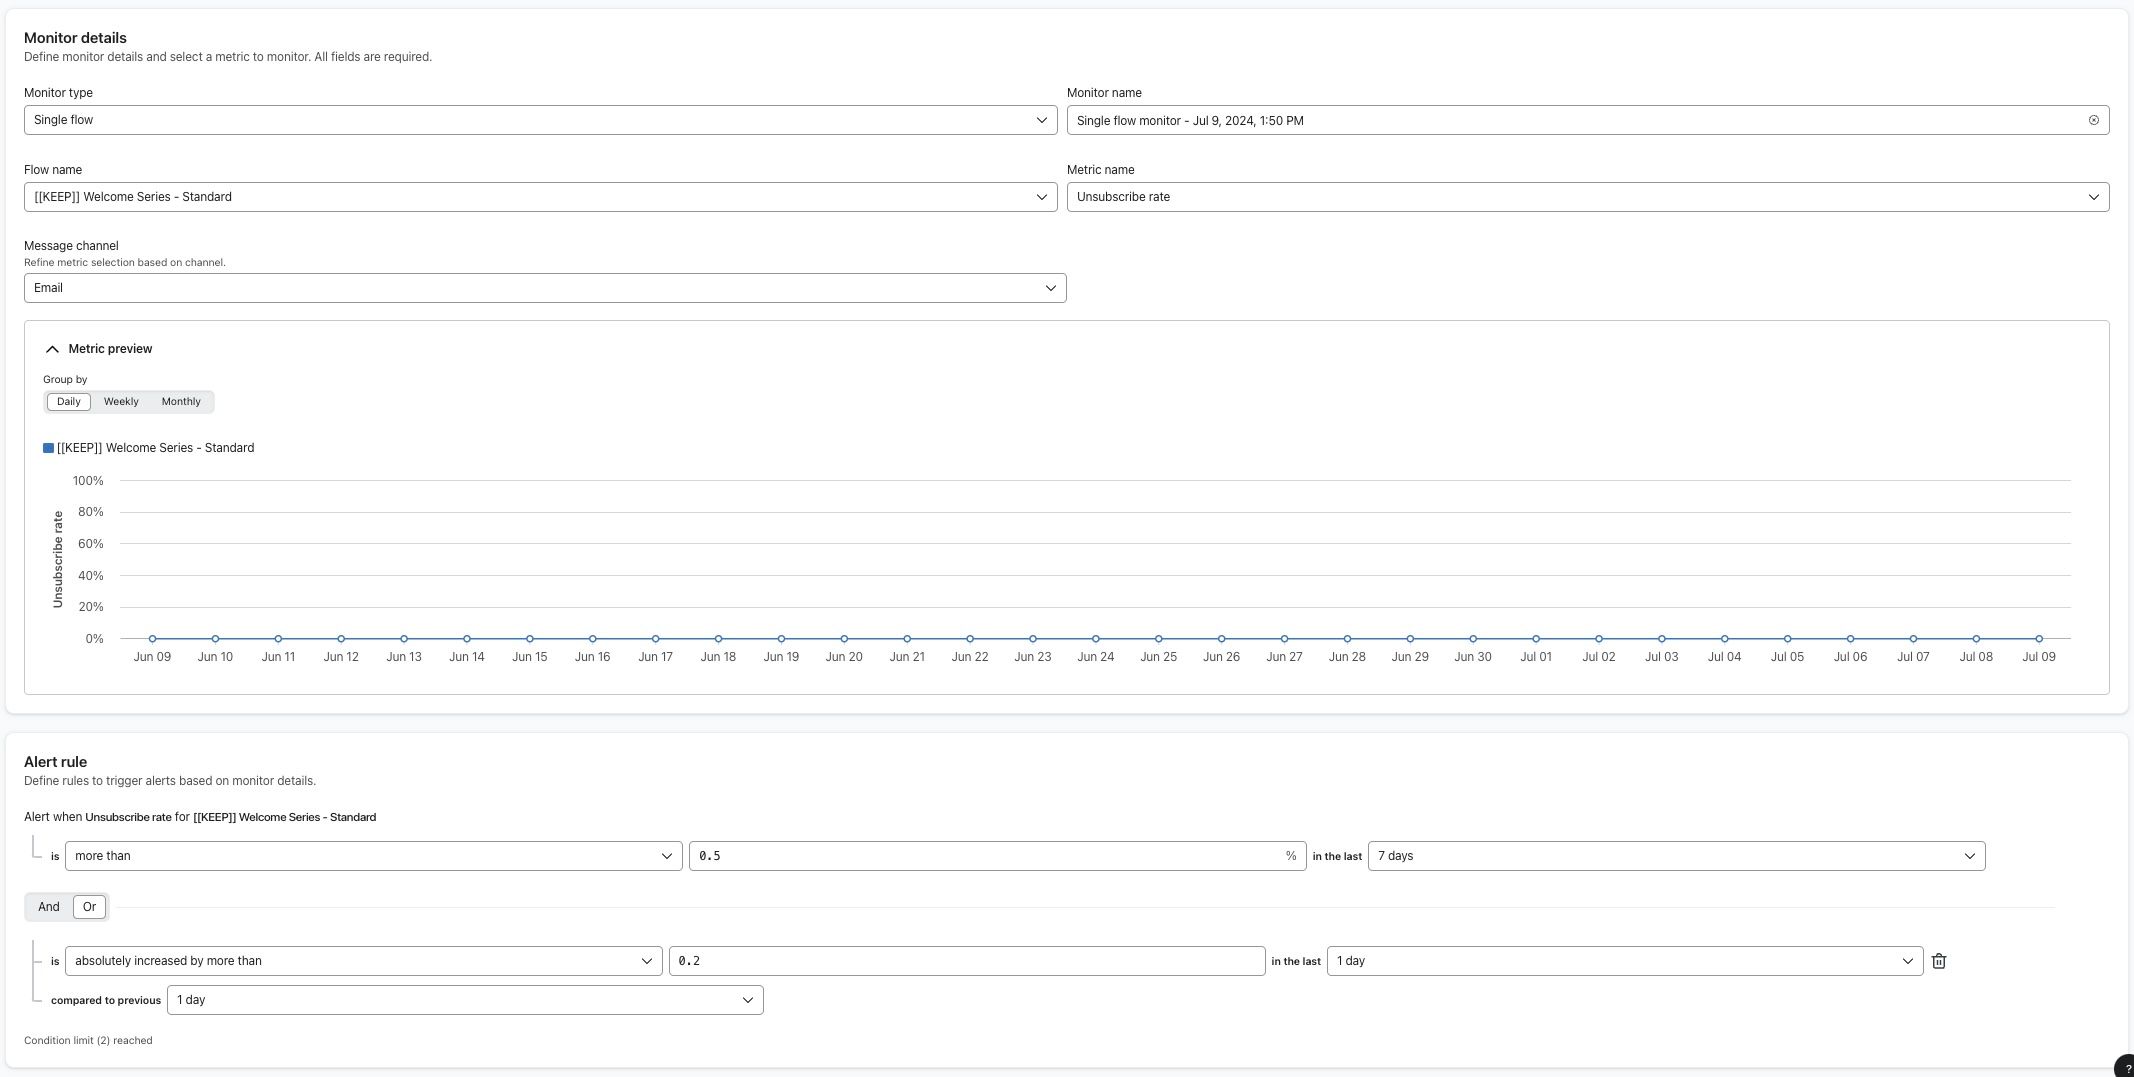
This first condition in this monitor checks the flow’s unsubscribe rate in the last 7 days and compares it to a threshold of 0.5%. If the unsubscribe rate exceeds 0.5% an alert triggers.
The second condition in this alert checks the unsubscribe rate for the flow in the last day compared to the prior day. If the unsubscribe rate increases by more than 0.2% from the previous day, an alert triggers.
Monitor conversions for a flow
With a Single flow monitor, you can create a monitor that proactively monitors the total number of conversions for key flows on your account. This is a way to spot drops in conversions in your flows, so you can resolve them before there is a significant impact on your revenue.
You can select any flow on your account, along with the channel you want to monitor (i.e., email or SMS conversions). Once you set the Monitor type and Metric name, you can use the Metric preview to see daily, weekly or monthly numbers of conversions to use as a benchmark for values in alert rules. In the section below, Placed order is used as the conversion metric.
For the alert rule, create the following 2 conditions, as shown in the example below:
- Alert when Sum of Total conversions for [flow] is less than 1000 in the last 7 days
OR
- Alert when Average of Total conversions for [flow] is absolutely decreased by 20 in the last 3 days compared to Average of the previous 3 days.
Use values that match the volume of conversions in your account based on the metric preview.
This first condition in this monitor checks the number of conversions from the flow in the last 7 days and compares it to a threshold of 1000. If the number of conversion drops below this threshold, an alert triggers.
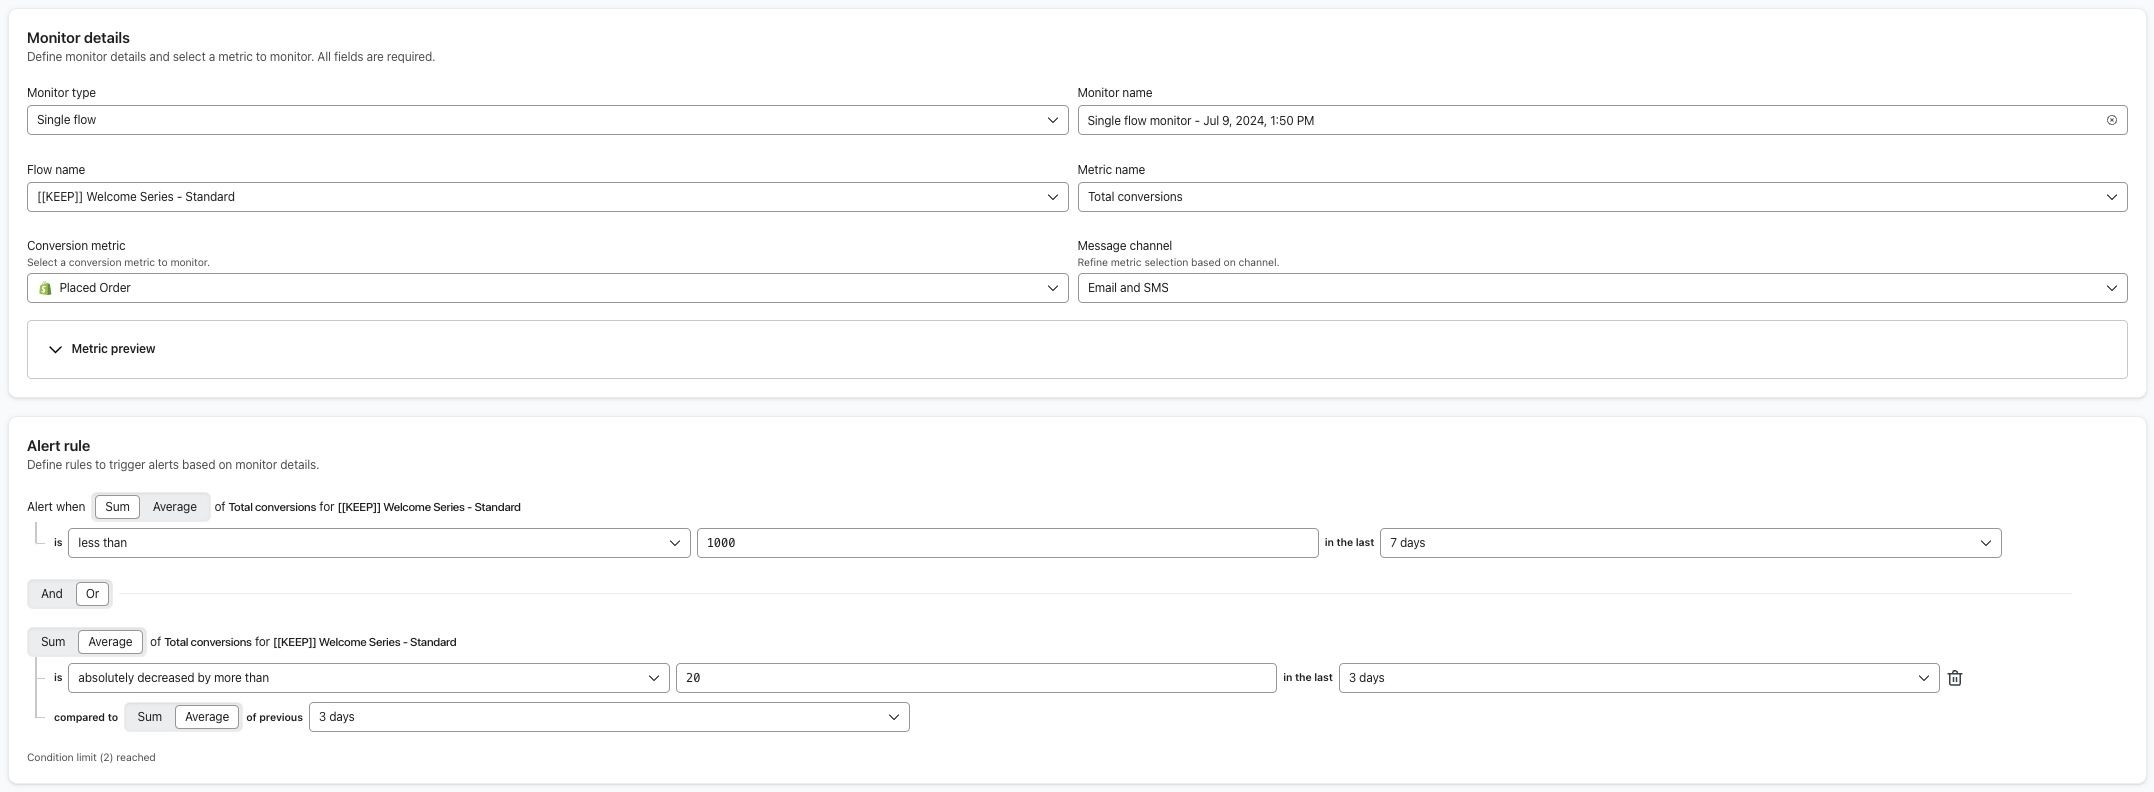
The second condition in this alert checks the average number of conversions from the flow in the last 3 days compared to the prior 3 days. If the number of conversions between these periods drops by 20, an alert triggers.
Monitor segment growth
With a Single segment monitor, you can create a monitor that proactively monitors the total number of added profiles in key segments. If you have any important segments on your account, this is a way to check that the segments are growing at expected rates so you can quickly investigate drops in growth rates.
Below is an example of a custom monitor you can set up for a segment. Once you set the Monitor type and Metric name, you can use the Metric preview to see daily, weekly or monthly numbers of added segment members to use as a benchmark for values in the alert rules.
For the alert rule, create something similar to the following 2 conditions:
- Alert when Average of Added members for [segment] is less than 1400 in the last 30 days
OR
- Alert when Sum of Added members for [segment] is relatively decreased by 15% in the last 7 days compared to Sum of the previous 7 days.
Use values that match the number of added members you are seeing on the metric preview.
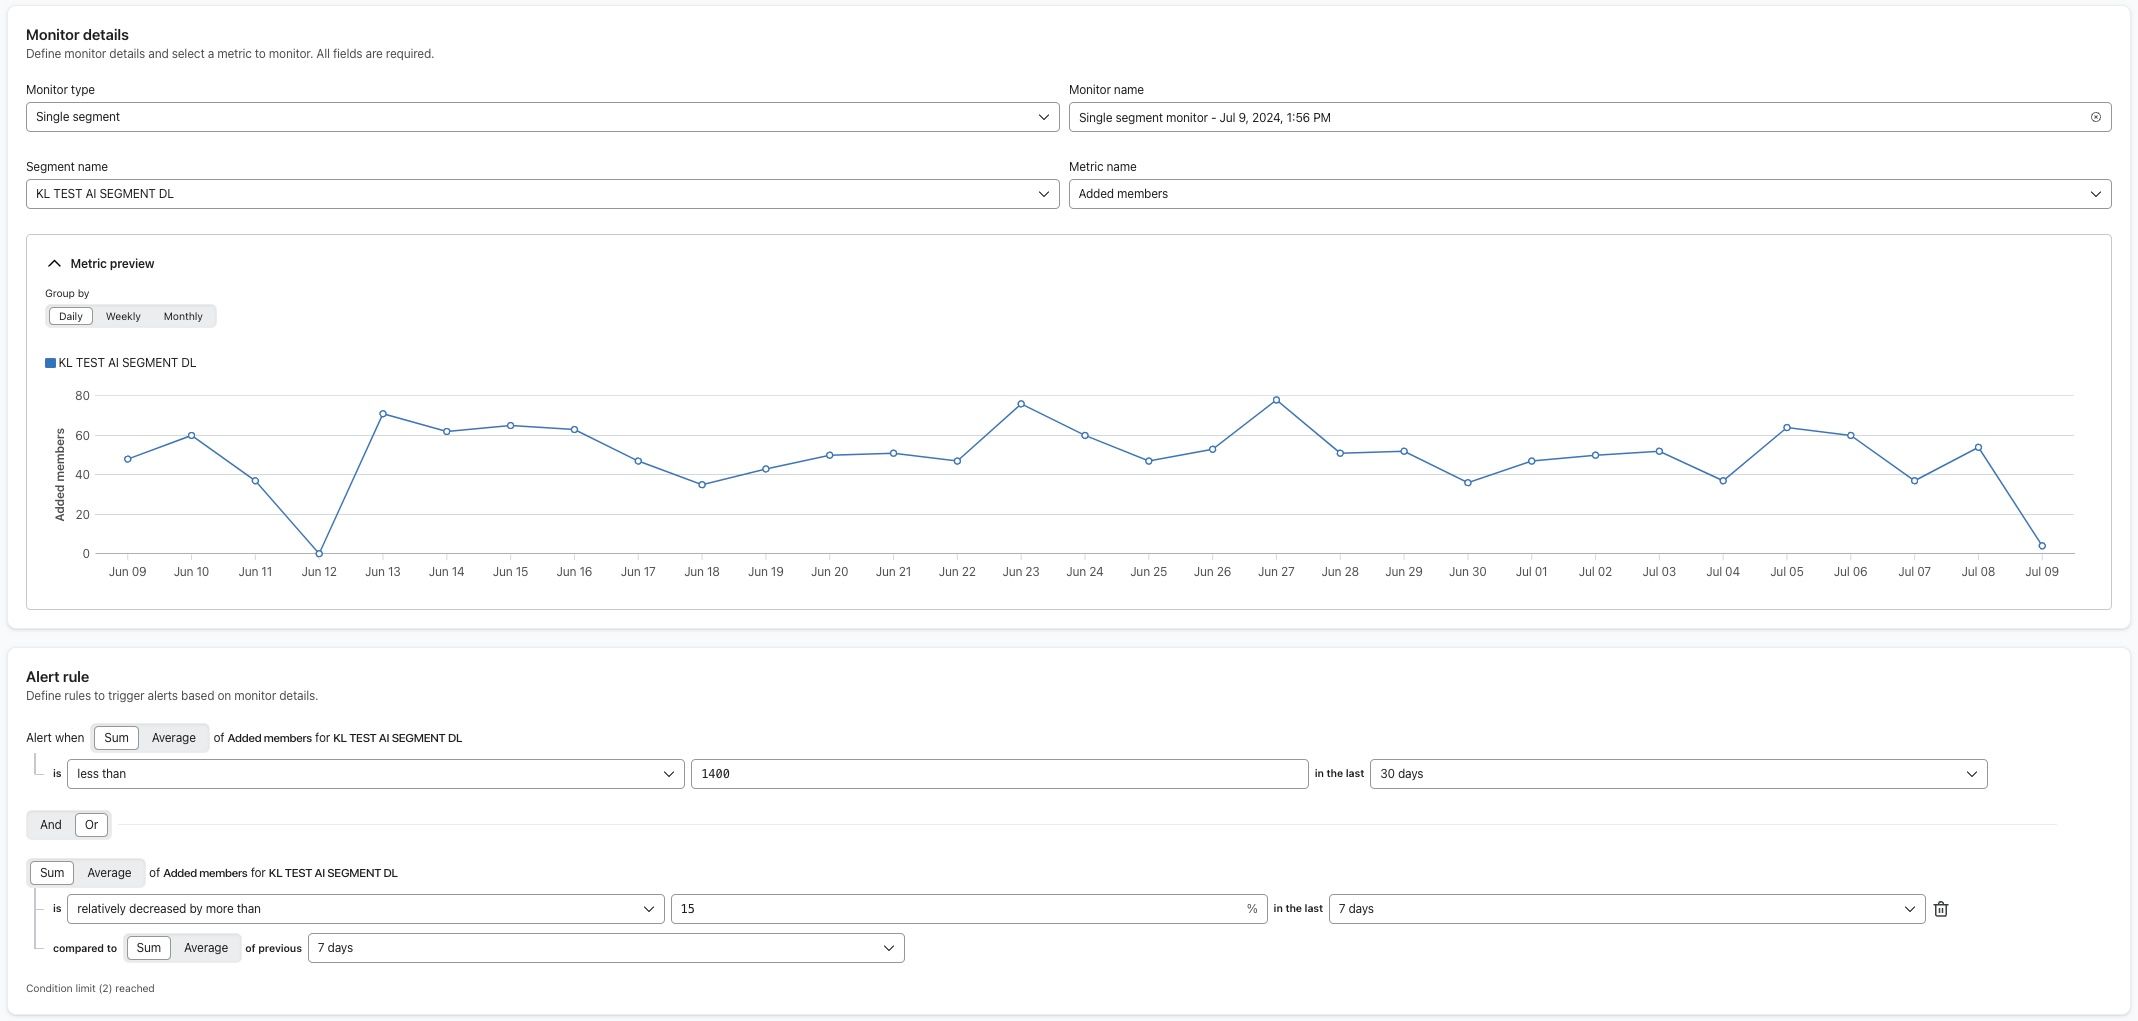
The first condition checks the average number of added members in the last 30 days, and if it drops by a threshold of 1400, an alert triggers.
The second condition checks the number of added members during the last 7 days in comparison to prior 7 days, and if there is a decrease of 15% between these periods, an alert triggers.
Monitor inbound data syncing
With a Single metric monitor, you can proactively monitor the health of custom or 3rd-party integrations using counts of key inbound metrics.
Below is an example of a monitor you can set up for an event called Filled out form that is being synced from a 3rd-party integration.
Once you set the Monitor type and Metric name, you can use the Metric preview to see the daily, weekly or monthly numbers of your events to use as a benchmark for the values in the alert rules.
For this example, the alert rule has the following condition as shown below:
- Alert when Average of Total number of Filled out form is relatively decreased by more than 50 in the last 3 days compared to Average of previous 7 days.
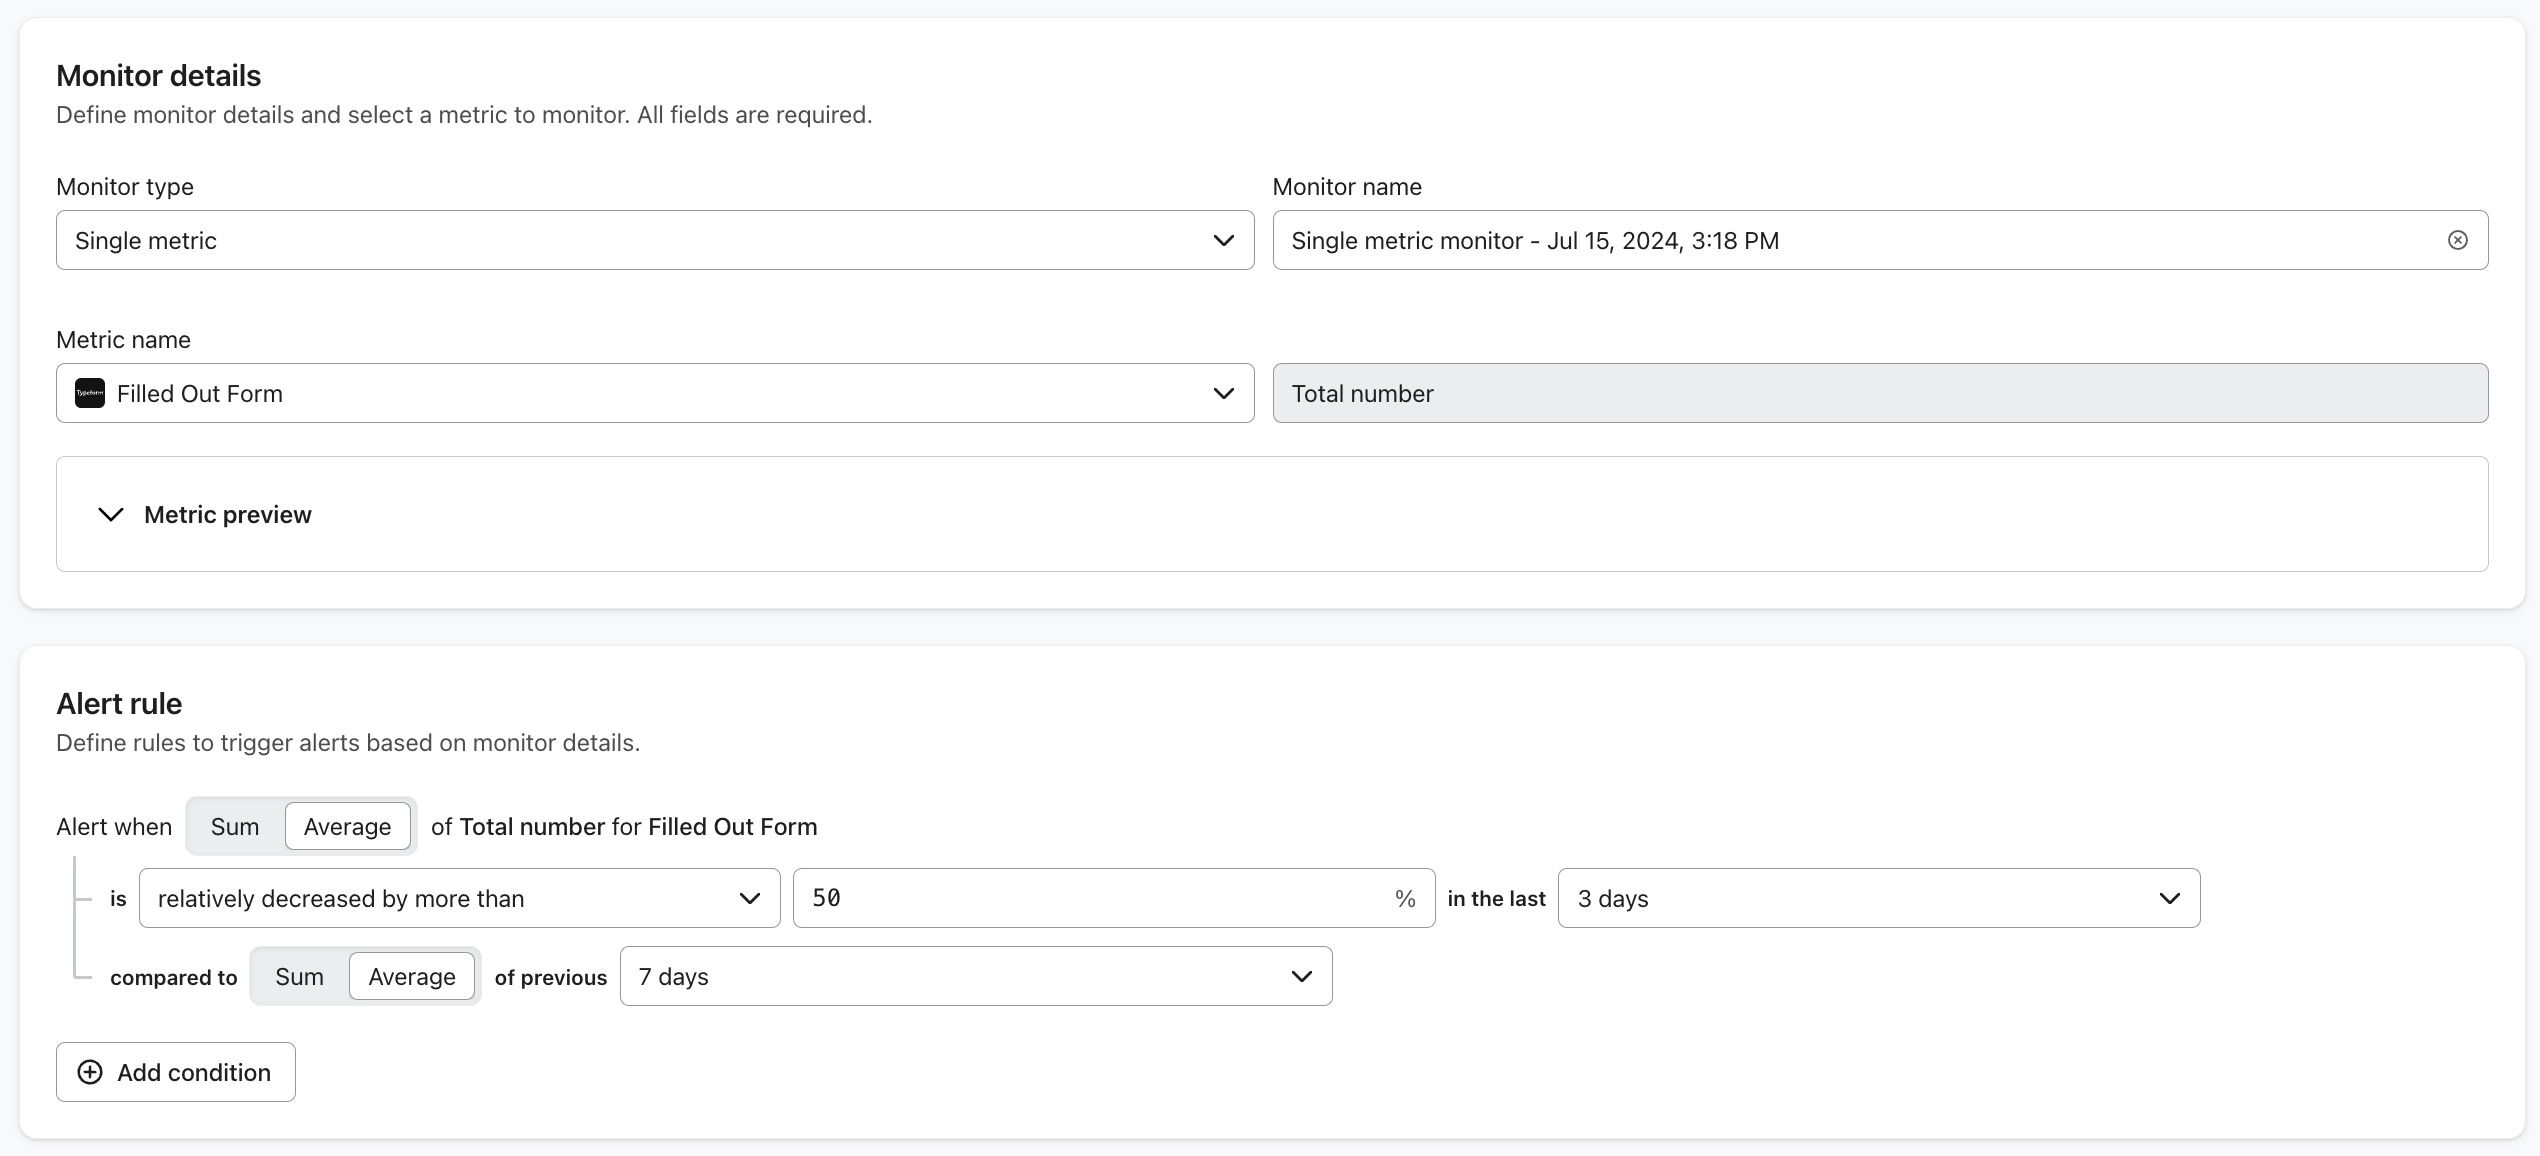
This condition calculates the average number of Filled out form events during the last 3 days and compares it to the average from the previous 7 days. If there is more than a 50% drop from the average of the previous 7 days, a notification will send and may indicate a problem with the health of your integration.
Additional resources
- Understanding auto-monitors in Klaviyo
Learn about auto-monitors in Klaviyo. Klaviyo automatically monitors your account performance for anomalies with key objects such as flows and campaigns. This allows you to quickly identify and resolve performance issues before they have larger implications.
- Understanding how Klaviyo monitors metric activity for flows
Learn how Klaviyo monitors and alerts you of unusual activity with ecommerce metrics that are used to trigger flows in your Klaviyo account. When a metric has a sudden drop in activity, you will be alerted so you can troubleshoot the potential issue. This type of monitoring is also known as anomaly detection.
- Getting started with Advanced KDP
Learn more about using Advanced KDP (Klaviyo data platform) to gather robust customer insights across all your marketing initiatives. Advanced KDP enables more advanced data management, manipulation, and analysis. It also provides actionable strategies to employ across each of your individual audiences and your business as a whole.