Understanding available campaign analytics
You will learn
Learn how to use Klaviyo's campaign reporting to gather insights on how your messages are performing and what happens after someone opens or clicks. Use these campaign analytics to dig deeper into website activity, checkouts started, and revenue that is directly attributabed to each message.
30-day total email performance
Navigate to your account's Campaigns tab. At the top of this page you'll see a 30-day view of your email performance. Below this, you'll see a list of all the campaigns (both email and SMS) you've created and sent.
Email performance for the last 30 days
Toggle open the Email performance last 30 days section to see how many campaigns you've sent within in the last 30 days and their average performance.
This performance section will appear if all of the following requirements are met:
Last 30 days
- At least 3 campaigns sent
- At least 100 recipients sent to
- At least 10 recipients per campaign
Last 30-60 days
- At least 3 campaigns sent
- At least 100 recipients sent to
- At least 10 recipients per campaign
Guided warming is not enabled (if qualified for account warmup)
If Klaviyo cannot determine your peer or industry, you will not see the View Benchmarks link at the top of the page.
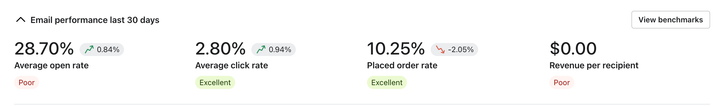
Along with your selected metric rate, you will also see any revenue or value (if a revenue-related metric was chosen), or total (if a non-revenue-related metric was chosen).
- Average open rate
The average rate at which people open your emails or the number of individuals opening your email divided by the number of total recipients. - Average click rate
The average rate of people who clicked a link in your message out of the people received it. - Placed order rate
This is calculated by taking the number of orders placed within the channel's attribution window divided by the number of unique recipients of that message. - Revenue per recipient
Your total revenue attributed to an email or SMS for a given timeframe divided by the total number of people who have received a message within that same timeframe. This can give you a sense of how much revenue you're earning on average for each person you send to.
Directly under the percentage or dollar amount, you can find a comparison of the numbers to those from the previous 30 days and an indicator that compares your performance to benchmarks from peers or similar companies. These statuses are Poor, Fair, Good, and Excellent.
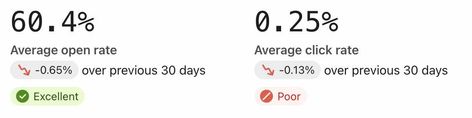
If you have a benchmarks peer group, Klaviyo will show your benchmarks compared to your peers. If not, it will compare you to benchmarks for your industry or overall Klaviyo ecommerce benchmarks if your industry is not set.
Your benchmarks will indicate where you fall into the following performance groupings:
- Excellent
75th percentile or better (highest tier of performance) - Good
50th–74th percentile (above average) - Fair
25th–49th percentile (slightly below average) - Poor
< 25th percentile (lowest tier of performance)
If any of your benchmarks are Fair or Poor, focus on bringing those numbers up. For information on how to do this, read this article on improving your benchmark performance. Additionally, if you see a sudden drop in clicks, you may want to review if you have recently removed bot clicks from your attribution.
Individual performance for sent campaigns
For sent campaigns, open and click rates are accessible from the list on the campaigns tab. The far-right column displays data around an adjustable conversion metric.
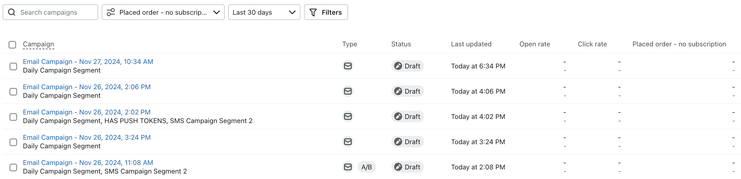
- To update the conversion metric used, choose an option from the Conversion metric dropdown.
This dropdown will include Klaviyo as well as any integration-specific metrics that you have enabled.
This allows you to get a comprehensive understanding of how your campaign performed across a number of different metrics by toggling in real-time.
Individual sent campaign activity
Overview tab
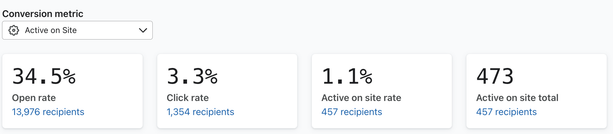
When you click on any individual campaign from the campaigns tab, you'll see more detailed analytics for that message. On this first overview page, you will see metrics related to clicks, opens, and your chosen conversion metric.
Many of these metrics will update over time while the campaign is in a sending state.
Besides your chosen metric rate, any revenue or value (if using a revenue related metric), or total (if using a non-revenue related metric), you’ll see the following:
- Open rate
The rate at which people open your emails or the number of individuals opening your email divided by the number of total recipients). - Click rate
The rate of people who clicked a link in your message out of the people received it.
Adjusting your conversion metric
The conversion metric used to generate this data can also be adjusted.
- To change the conversion metric in this view, choose an option from the Conversion metric dropdown.
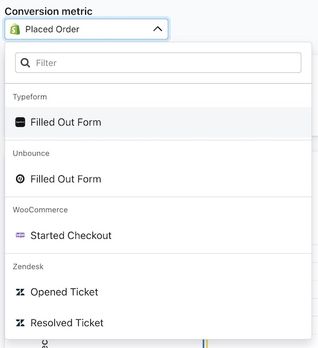
This dropdown will include Klaviyo and any integration-specific metrics that you have enabled.
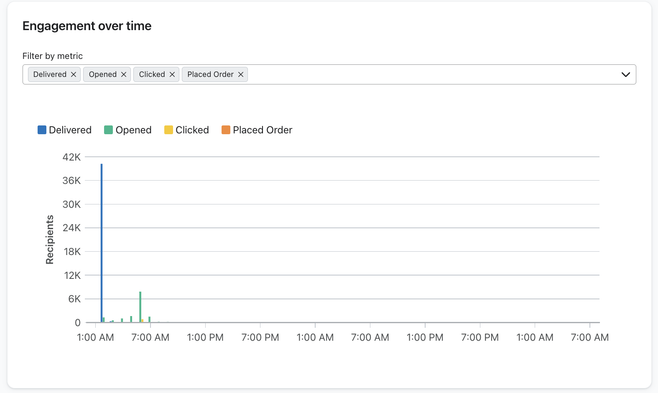
Engagement over time card
On the overview tab, the engagement over time card provides key data related to your campaign since it was sent. In addition to your chosen conversion metric, you can review the number of deliveries, opens, and clicks visualized as bar graphs over time. Hover over any of these bars to see the metrics for that point in time.
Deliverability card
The deliverability card provides a snapshot of your campaign's deliverability performance at that point in time. If you select View more, you will go to the full deliverability review section.
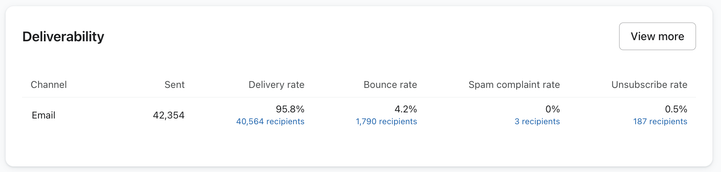
The metrics on this card include:
- Channel
The marketing channel (email, SMS, WhatsApp or push) used to send this particular campaign. - Sent
This is the total number of confirmed sends (both successful deliveries and bounces). - Delivery rate
This rate is calculated by taking the number of emails successfully delivered to recipients' inboxes divided by the total number of emails sent. This area also includes the total number of confirmed email deliveries. - Bounce rate (email only)
This rate is calculated by taking the number of bounced addresses divided by the total number of recipients. This area also includes the total number of email bounces. - Spam complaint rate (email only)
This rate is calculated by taking the number of spam complaints from a particular email divided by the total number of recipients. This area also includes the total number of spam complaints. - Failed deliveries (SMS and WhatsApp only)
The number of SMS and WhatsApp campaigns that failed to send to any profile. Learn more about reasons for SMS failures. - Unsubscribe rate
This rate is calculated by taking the number of recipients who unsubscribe divided by the total number of recipients. This area also includes the total number of spam complaints.
Content card
The content section on the overview tab contains a summary of your campaign. For email, this includes:
- Subject
The subject line of the campaign. - Preview text
The summary text for a campaign. - From/reply-to
The sender email set for the campaign. - Included lists and segments
Details on the lists and segments included in the campaign. - Excluded lists and segments
If applicable, details on any lists or segments that were excluded in the campaign send. - Sent
The date/time the campaign was sent. - Recipients attempted
The number of campaigns that were attempted to be sent or the number of delivered, skipped, or bounced (email only). This number can change over time since as a campaign is in a sending state. - Recipients skipped
The number of recipients who were skipped because smart sending is enabled and they received a message from the same channel (e.g., email or SMS) too recently. - Recipients sent
This is the total number of confirmed sends and includes both successful deliveries and bounces (email only). This number also will change over time while the campaign is in a sending state. - Recipients bounced (email only)
This is calculated by taking the number of bounced addresses divided by the total number of recipients. - Recipients delivered
This is calculated by taking the number of campaigns successfully delivered to recipients' inboxes divided by the total number sent.
Recipient activity tab
The recipient activity tab contains detailed information about your recipient engagement. The sections on the left represent the potential different recipient activities (e.g., scheduled, clicked, opened, bounced, unsubscribed, etc.).
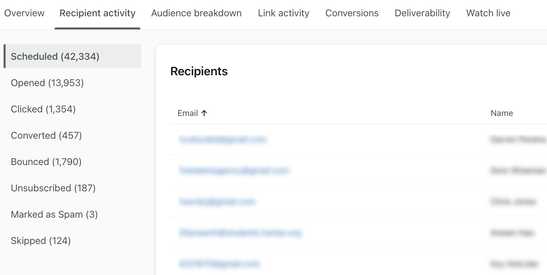
These activities could include:
- Scheduled
The number of recipients Klaviyo has determined should receive the campaign at the scheduled time. - Opened
Recipients who opened your campaign. - Clicked
Recipients who clicked into your campaign. - Converted
Recipients who converted from this campaign. - Bounced (email only)
When trying to send to these people, Klaviyo received a delivery failure notification. - Unsubscribed
Recipients who unsubscribed through the unsubscribe link in your email. - Marked as spam (email only)
People who have marked this email as spam after receiving it. - Skipped
Recipients who were skipped because smart sending is enabled and they received a message from the same channel (e.g., email or SMS) too recently.
You will only be able to see Skipped recipients for campaigns sent on or after April 15, 2026. For campaigns sent before April 15, 2026, only the total number of skipped recipients is available. Individual skipped-recipient records are not available for campaigns sent before this date.
- Failed (SMS and WhatsApp only)
If an SMS and WhatsApp campaign fails to send to any profile, the send failed section will show why. Learn more about reasons for SMS failures.
Within each of these sections, you may see the following information about them:
- Email address
The email address of every potential recipient. - Name
Name of every potential recipient. - Opens
The number of times each recipient opened your campaign. - Clicks
The number of times each recipient clicked a link in your campaign. - Conversions
The number of individual conversions associated with that campaign. - Failed reason (SMS and WhatsApp only)
Why an SMS and WhatsApp message may have failed to make it to a recipient. Learn more about reasons for SMS failures. - Bounce category, bounce type, and bounce reason (email only)
These columns contain information on what category of bounce it represented, the type (hard or soft), and the ultimate reason for that specific recipient and/or error code. Learn more about email bounces, causes, and potential solutions. - Time
The timestamp associated when a recipient was skipped, marked the campaign as spam, or unsubscribed.
Audience and segment breakdown tab
To better understand the performance of specific lists or segments, you can isolate this data for both sent email and SMS messages in the audience breakdown tab.
You will only be able to see the audience breakdown tab, and thus segment or list metrics, if the campaign was sent to at least 2 lists or segments for a respective campaign. Also, segment-level data is only available from July 1, 2022 onwards. Thus, any campaign that was sent prior to this date, will not be viewable in the audience breakdown tab. Additionally, if a profile is part of more than one segment in a campaign send, their metrics will be counted once per segment. As a result, data in this chart may be higher than campaign totals.
Once you are inside this tab, you can review your lists or segments and their corresponding performance metrics.
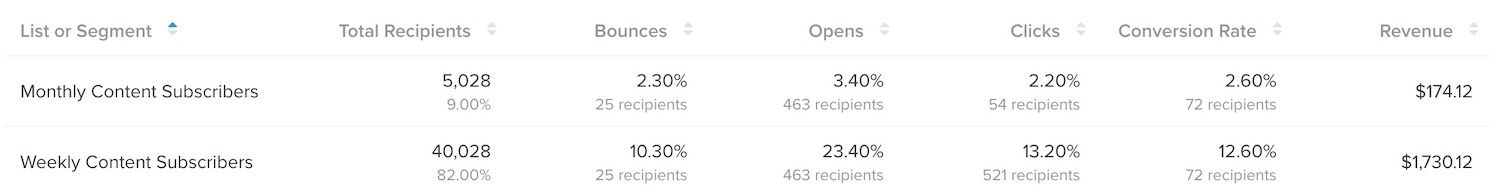
These performance metrics include:
- Total Recipients
The total number of recipients sends, including bounces or failures to deliver. The bottom percentage represents the delivery rate out of the total list or segment size. - Bounces (email only)
The top percentage represents the bounce rate out of the total list or segment size. While the bottom number represents the number of emails that bounced or could not be delivered. - Failed to deliver (SMS only)
This percentage represents the delivery failure rate out of the total number of messages sent. While the bottom number represents the number of SMS messages that could not be delivered. - Opens
The top percentage represents the number of email opens out of the total number of successful deliveries. While the bottom number represents unique opens. Note that opens here do not include SMS messages. - Clicks
The top percentage represents the number of email or SMS messages clicked, out of the total list or segment size. While the bottom number represents the unique email or SMS clicks. - Conversion rate
This conversion rate reflects the conversion metric selected for your account, with the top number showing this rate and the bottom number the unique amount. - Revenue
This is only available if your conversion metric has a monetary value (the $value field) associated with it (e.g., “Ordered Product,” “Placed Order,” etc.).
By using any of the arrows next to each column's name, you can also sort by any column.
Link activity tab
The Link Activity tab contains analytics for the links tracked in your campaign email, SMS and WhatsApp. Klaviyo tracks who has clicked a link in the email/SMS, how many times they've clicked, and how many times the links have been clicked overall.
For email campaigns, you can see view a table view showing:
- A summary of click performance
- A list of the top 25 links in each campaign
- The total clicks for each link
- The total unique clicks for each link
UTM tracking
Currently, automatic UTM tracking is only available for email and SMS campaigns. If you send out mobile push campaigns, you can manually add UTM parameters; however, these will not be tracked in Klaviyo.
In the UTM Parameters section, you will see all the UTM parameters and values that were tracked for the campaign. This will only include any campaign-level settings, not any UTM parameters that were manually set.
At this time, visual link tables are not available for campaigns that utilize UTM variations.
Tracking links
The link activity report will only record clicks to unique URLs. If you have several elements in your email that link to the same URL, you will not be able to tell which element got clicked the most.
Having multiple links is not advised for text messages. These messages should be clear and concise, so it’s better to include just one link as your call to action.
If you'd like to differentiate between elements that link to the same location, you can add identifying URL parameters to your links in your email. For example, instead of having a button and an image, both link to www.example.com, you could have:
www.example.com/?link=button
and
www.example.com/?link=image
Both of the links would still go to the same place, but they will be tracked separately in the Link Activity report.
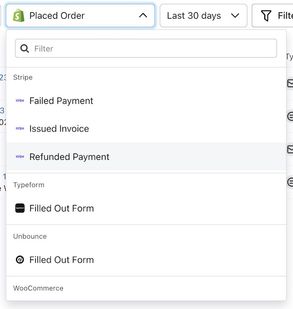
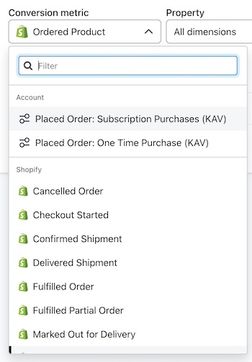
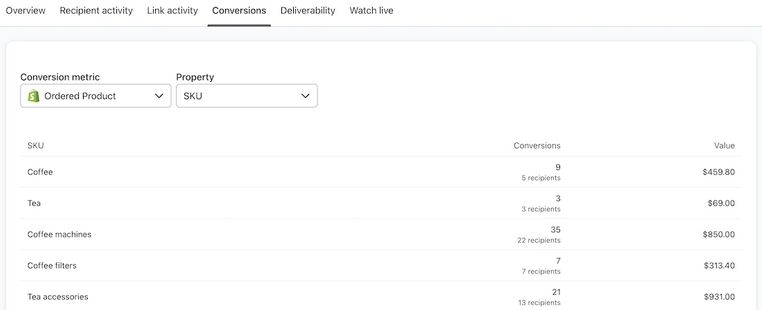
Conversions tab
To review your conversion performance (email, SMS, WhatsApp or push) against certain metrics, head to the Conversions tab. Here you will be able to choose the specific metric (e.g., Placed Order, Ordered Product, Active on Site, etc.), the number of said conversions, and how to classify this data (e.g., revenue, types of products, locations, successful deliveries, etc.).
It is recommended to use Ordered Product as your metric in this view if you want to see total conversions or revenue for individual items. For example, if you have a $15 item that is part of a $100 order and a $150 order, it would reflect as $30. However, if you were to use Placed Order as the metric, each item would show as the total value of the order it is a part of. Using the same example above, the item revenue will reflect as the total of the orders or $150.
- In the Conversion metric dropdown, choose the metric you want to review. This dropdown will contain all Klaviyo-specific, integration, and custom metrics you have set up.
- Choose how you would like your metric success displayed via the Property dropdown. In the example below using Ordered Product, you have the option to display All conversion success information or just by certain dimensions or types. For example, you could analyze conversion information based on product types, locations of purchases or shipments, customer demographics, or other factors. Keep in mind that these properties will be relative to how you have them set up, the metric you are reviewing, and your integration.
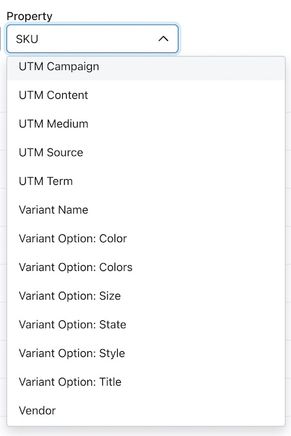
Once you have chosen your metric and how it will be measured, it will appear on the card. In the example below, using Ordered Product and property as SKU, you can review specific conversions by SKU type.
Deliverability tab (email only)
To review your deliverability metrics for a single email campaign, head to the Deliverability tab. Here, you can see more details around your overall deliverability through the lens of a specific campaign.
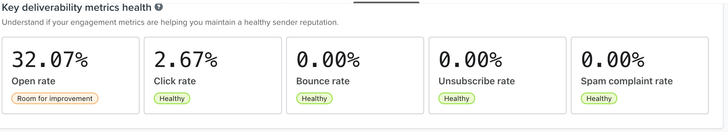
Key deliverability health metrics card
Key deliverability metrics like click, open, and unsubscribe rate are marked as Healthy, Room for improvement, or Needs attention.
If any deliverability metrics need attention, consider taking action to improve them for future campaigns.
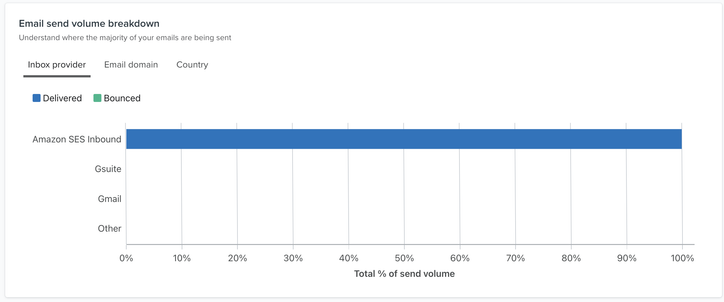
Email send volume breakdown card
This card visualizes deliveries and bounces across your specific providers, email domains, and countries where recipients are located. You can also dive deeper into performance by:
- Inbox provider (e.g., Gmail, Yahoo)
- Email domain (e.g., @klaviyo.com, @gmail.com)
- Country
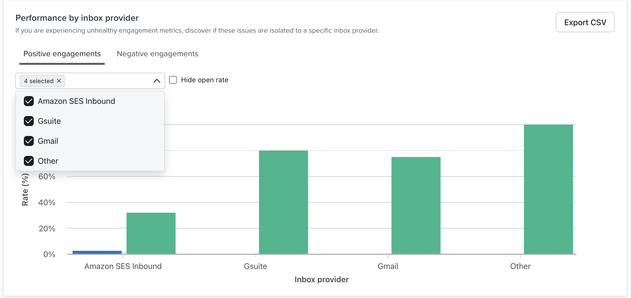
Performance by inbox provider, email domains, and country cards
Each of these cards visualizes the number of positive engagements (expressed as clicks and opens) and negative engagements (expressed as bounce, unsubscribe, and spam complaint rates) across each individual domain, inbox provider, or country.
Additionally, you can open the dropdown on each card to narrow the items it pulls into the chart or click Export CSV to download this data, as shown in the example below.
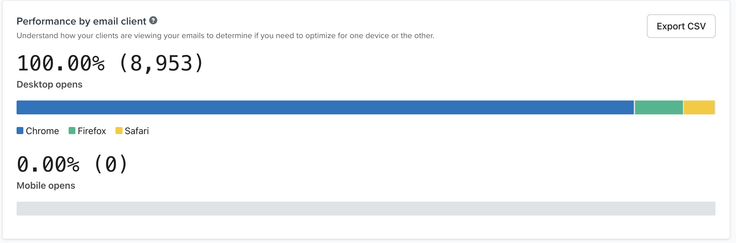
Performance by inbox provider card
This card provides a breakdown of each desktop or mobile provider (e.g., Safari, Chrome, Firefox) and the total percentage of email opens these represented. You can also click on Export CSV to download this data.
Watch live tab (email only)
You can also use the Watch live tab to view email campaign metrics as they unfold. Note that this is not available for SMS messages. Learn more about the activity map for sent campaigns.
Additional resources
- Getting started with reporting
Learn about the different robust Klaviyo reporting tools available in your account. Klaviyo is built to help your business grow and strengthen your relationships with your audience by putting data to work. Segmentation and automation tools allow you to personalize and target your communication efforts across channels to boost engagement and drive business growth. However, in order to understand how well your business strategies and marketing efforts are working, you need proper reporting to measure and analyze performance trends over time.
- Getting started with custom reports in Klaviyo
Learn how to use Klaviyo custom reports to monitor your business' health across each of your marketing channels and individual products or services. By using these reports, you can leverage your data to uncover trends in customer behavior, align your team around a cohesive marketing strategy, and grow your business as you act upon new insights.Just starting out with Klaviyo reporting? Learn more about feature-specific reports and get a general overview of Klaviyo’s analytics tools.