How to access and use the activity map
You will learn
Learn more about the Klaviyo activity map and how it allows you to visualize how, where, and how often customers interact with your brand. The activity map helps you understand your customers and use live data to create personalized content and grow your business.
Accessing the activity map
From the analytics tab
There are a few ways to see the data coming into your account through the Activity Map.
- Navigate to Analytics > Metrics.
- Click on the metric you want to investigate (e.g.., Clicked Email). You can either find this from the alphabetical list or by using the search field at the top of the page.
- Hover over this metric and open the More dropdown menu and choose Activity Map.
From specific campaigns
- Navigate to Campaigns.
- Choose either a sent campaign directly from the list below or use the Filter option to short by Sent.
- Click the Watch live tab. From here you will be directed to the activity map page.
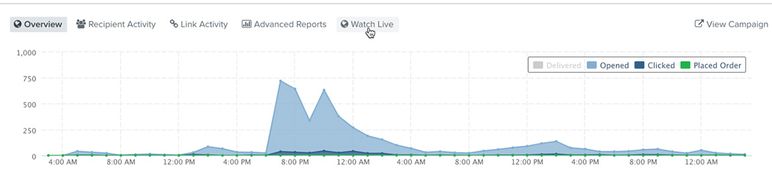
The Watch live feature is not available for campaigns that are part of an A/B test.
Using the activity map data
Once on the activity map page, hover over each circle to see the total number of interactions for the metric in your chosen time period. By clicking on a circle, you can see the number of customers who triggered an event in that location.
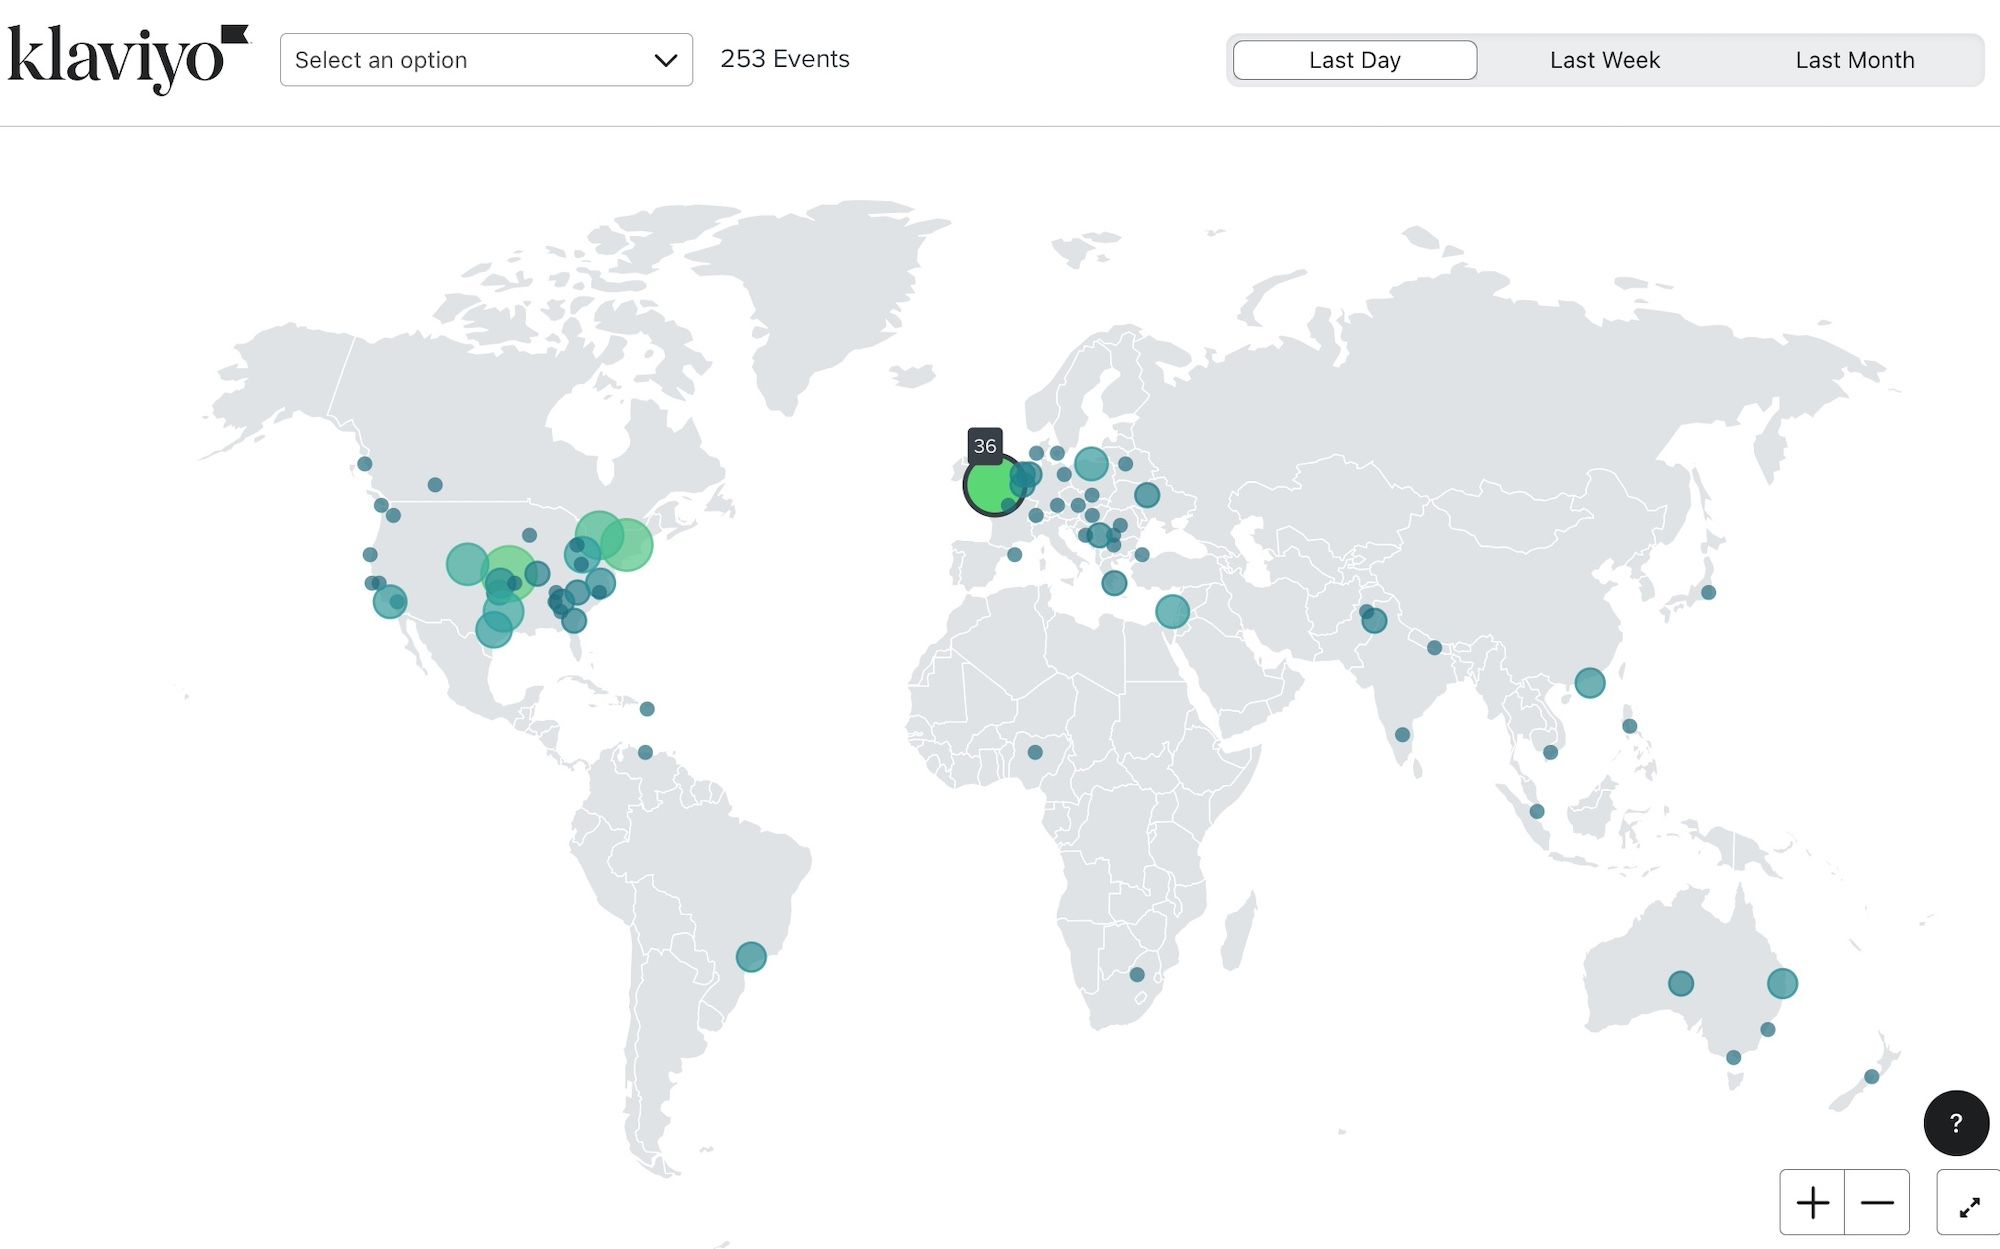
It's important to note that when you land on the activity page, it will not default to the metric you had already chosen. Instead, you will need to find this again from the Select an option dropdown above and select what metric you want to analyze. Only Klaviyo metrics are available here.
You can also choose a different metric from the Select an option dropdown and adjust the timeframe (i.e., Realtime, Last Day, Last Week, or Last Month).
Additionally, you have the option to toggle to a full screen view and zoom in and out with the options in the lower right of the map screen.
Additional resources
- Getting started with reporting
Learn about the different robust Klaviyo reporting tools available in your account. Klaviyo is built to help your business grow and strengthen your relationships with your audience by putting data to work. Segmentation and automation tools allow you to personalize and target your communication efforts across channels to boost engagement and drive business growth. However, in order to understand how well your business strategies and marketing efforts are working, you need proper reporting to measure and analyze performance trends over time.
- Getting started with custom reports in Klaviyo
Learn how to use Klaviyo custom reports to monitor your business' health across each of your marketing channels and individual products or services. By using these reports, you can leverage your data to uncover trends in customer behavior, align your team around a cohesive marketing strategy, and grow your business as you act upon new insights.Just starting out with Klaviyo reporting? Learn more about feature-specific reports and get a general overview of Klaviyo’s analytics tools.