Understanding the Customer Hub overview dashboard
You will learn
Learn how to use the Customer Hub overview dashboard to analyze how your shoppers are engaging with Customer Hub and measure its impact. This guide will help you interpret the metrics on the Customer Hub dashboard.
Customer Hub for Shopify currently supports standard storefronts and Shopify Headless. For WooCommerce, navigate to https://help.klaviyo.com/hc/en-us/articles/47792369863451
Before you begin
This guide breaks down the data that displays on the Customer Hub dashboard in Klaviyo. You must have the Customer Hub feature enabled to access this dashboard.
Your store integration must have Placed Order and Ordered Product metrics for the reporting sections to appear.
If you prefer to have your key metrics delivered to your inbox, set up performance digest emails.
Learn more about Customer Hub.
About the Customer Hub dashboard
Your Customer Hub overview dashboard in Klaviyo provides a summary of how site visitors are interacting with your Customer Hub. The metrics on this dashboard can also give you a better understanding of how Customer Hub is contributing to your revenue and conversion goals.
To view your Customer Hub overview dashboard, navigate to Website > Customer Hub in Klaviyo, then select Overview in the left-hand menu.
The following sections display on the Customer Hub dashboard:
- Overview
A summary of key Customer Hub metrics showing how customers interact with their accounts and allowing you to assess engagement with Customer Hub - Customer Hub attributed revenue
Revenue over time, broken down by the source of the product interaction - List Growth
SMS marketing subscriptions collected through Customer Hub - Interactions summary
A table showing self-service interactions, web chat conversations, and content-block clicks - Average order value
A graph of average order value for customers with Customer Hub accounts over the selected time period - Content blocks
A table displaying your content blocks with their unique clicks and click through rate - Favorites
A summary of how customers engage with your products through Favorites and the revenue impact of the Favorites extension.
Use the Time period selector above the Overview section to choose a date range and comparison period, then click Apply. Dates are inclusive: a custom range from February 1 through February 7 includes both days. Total accounts always shows all-time data, regardless of the selected date range.
Reports need recorded shopper activity to show results. If you hide Customer Hub after collecting data, historical results remain available. Web chat can remain available separately, so hiding Customer Hub does not necessarily stop all dashboard activity.
Overview section
The Overview section shows 4 key Customer Hub metrics that can help you understand Customer Hub's effect on engagement and revenue:
- Total accounts
The number of unique customers who have logged in to Customer Hub, across all time. This includes existing customers who log in, not just newly created accounts. - Service interactions
The total number of tracked interactions within the selected time period, including order tracking, help requests, web chat conversations, and content-block clicks. - Engagement
The number of unique customers who opened Customer Hub within the selected time period. - Revenue generated
The revenue from products purchased within 24 hours of a qualifying product interaction in Customer Hub. Revenue is included if:- A customer clicks a product displayed in Customer Hub and buys that product within 1 day.
- A customer adds a product to their cart from Customer Hub and buys that product within 1 day.
- A customer clicks the “Buy again” button on an order summary page in Customer Hub and places an order for that product within 1 day.
If a product is purchased more than 24 hours after the qualifying interaction, or was not clicked or added to the cart through Customer Hub, revenue from that product is not attributed to Customer Hub.
Klaviyo displays change from the selected comparison period for Service interactions, Engagement, and Revenue generated. A positive change shows in green text, while a negative change shows in red text. If the comparison value is 0, Klaviyo shows the change as a count or currency amount instead of a percentage. Comparisons are not shown for All time.
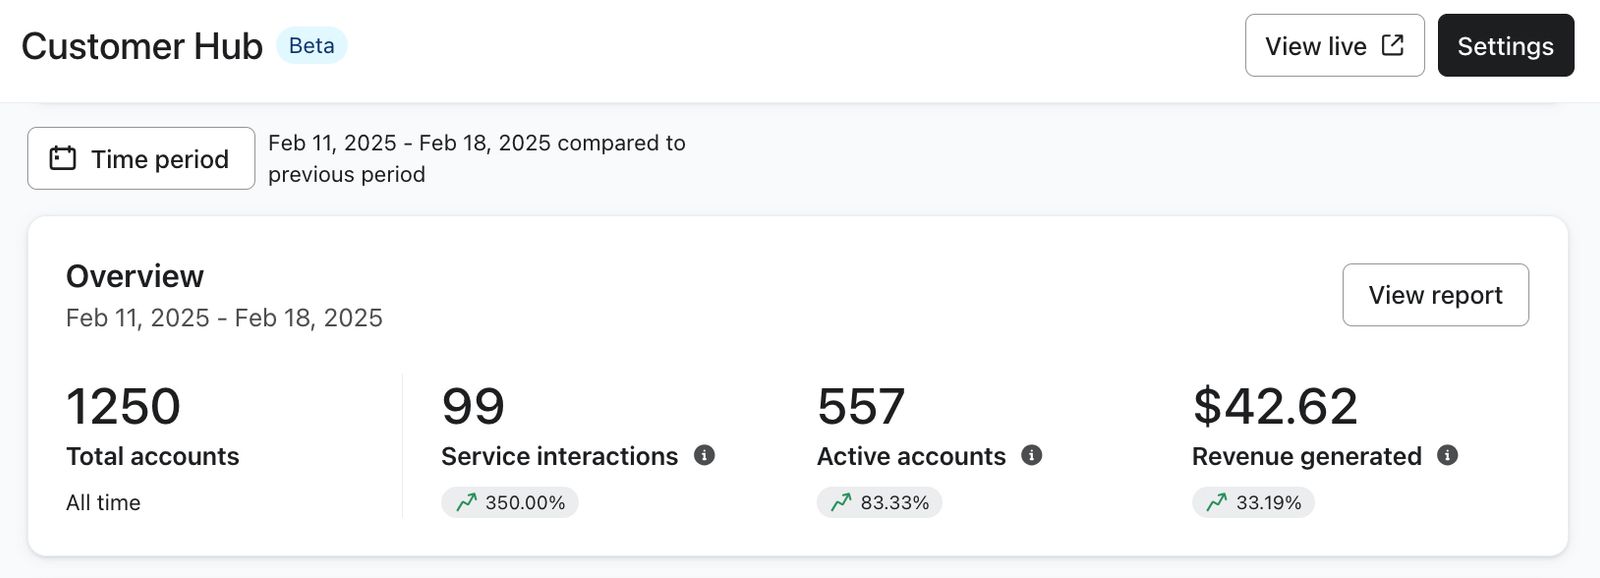
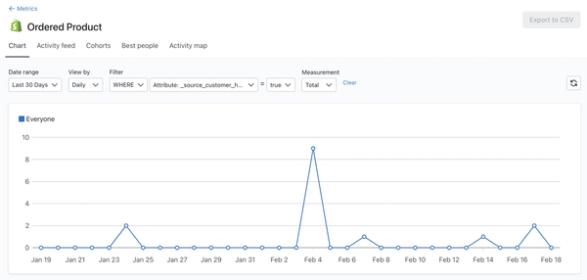
Additionally, you can click View report to view the Ordered Product metric page filtered to products added to the cart through Customer Hub. This report uses a different filter from the dashboard’s 24-hour attribution model, so its revenue total can differ.
Customer Hub attributed revenue
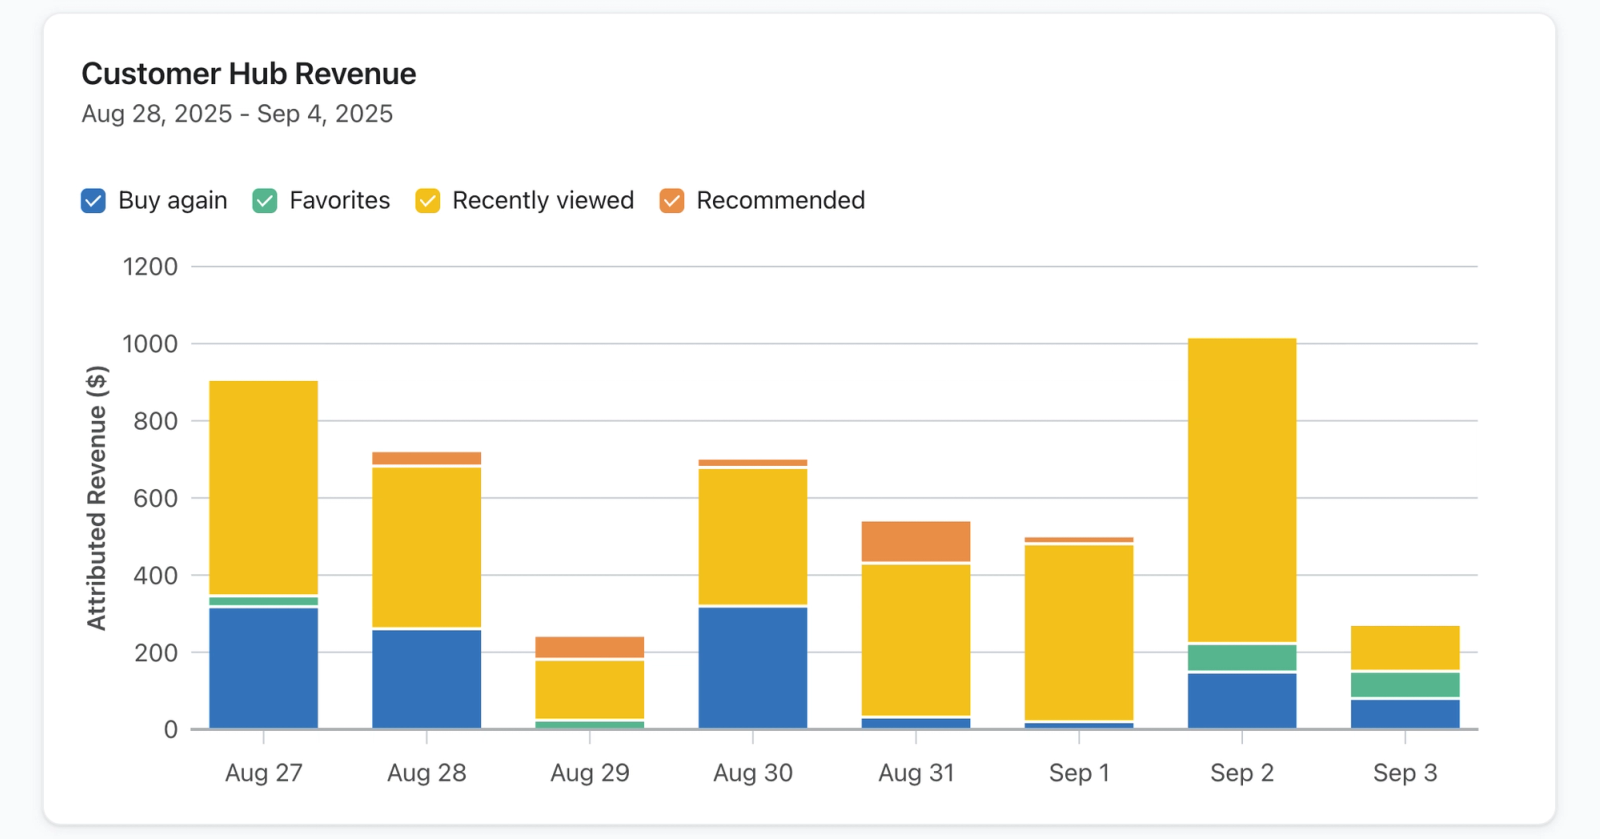
The revenue section shows how your Customer Hub has been generating revenue for your business.
Customer Hub uses a simple last-click, 24-hour attribution model. This means if a shopper clicks on a product within Customer Hub, or directly adds a product to their cart within Customer Hub, and then buys it within 24 hours, the revenue from that specific product (not the entire order) will be attributed to Customer Hub. Since Customer Hub does not directly bring in new traffic to your site, its attributed revenue is reported separately from Klaviyo attributed revenue. Use this figure to understand purchases associated with Customer Hub interactions; it does not establish how much additional revenue Customer Hub caused.
Revenue is displayed over time and broken down by source:
List Growth
The List Growth section shows SMS marketing subscriptions collected through Customer Hub during the selected time period, with a comparison to the selected comparison period. Use it to see how Customer Hub contributes to your SMS audience.
Interactions summary
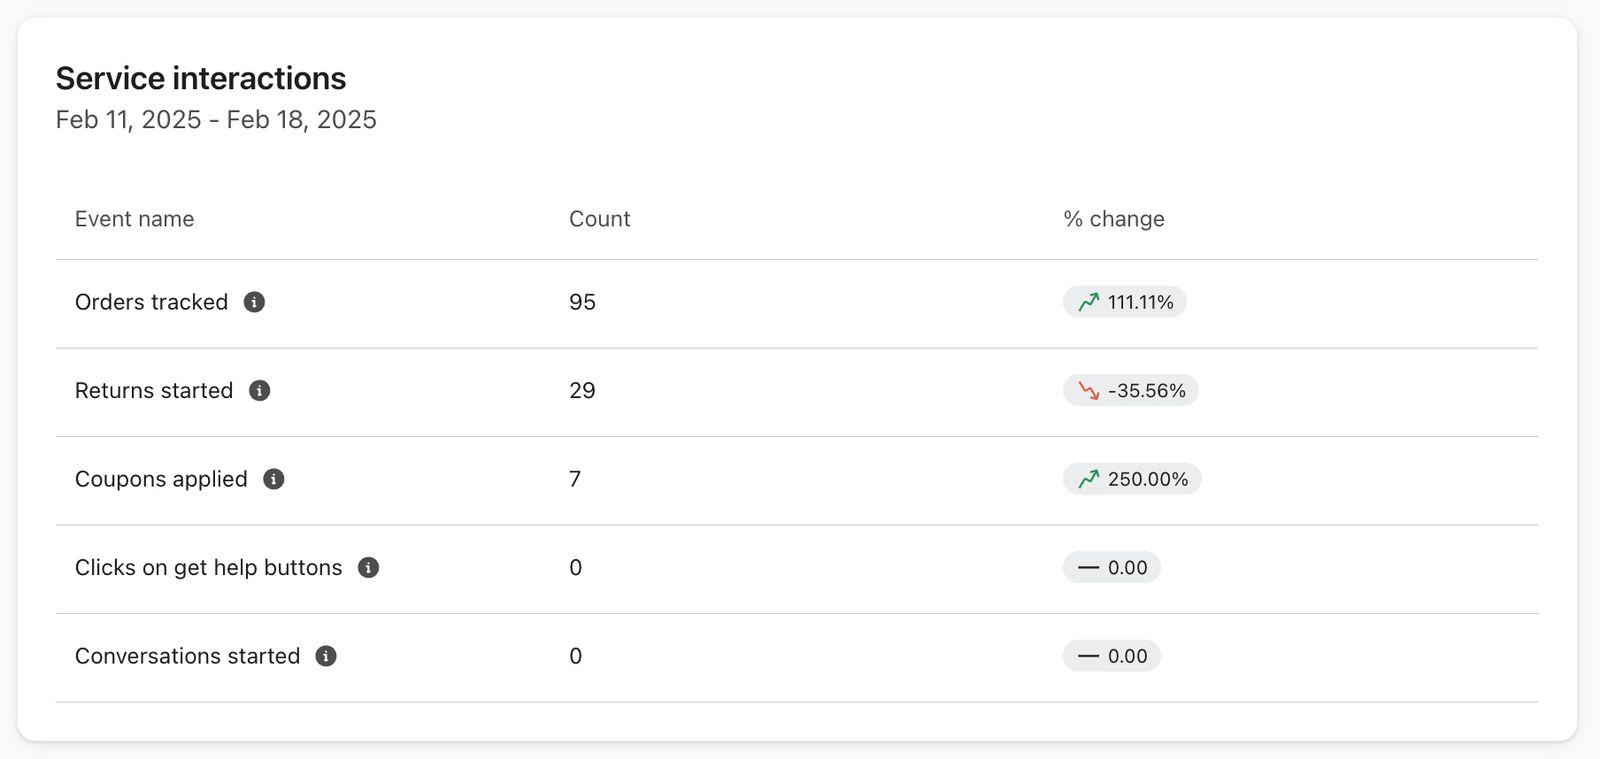
The Interactions summary section shows self-service support interactions, web chat conversations, and content-block clicks from Customer Hub. This information helps you understand which options your customers use so you can improve their experience and save your support team time.
Each interaction is linked to a corresponding event in Klaviyo and is tallied each time a user performs that action. For example, Customer Hub Clicked Track Shipment is recorded when a customer clicks to track an order. Tracked interactions include:
- Orders tracked
- Returns started
- Coupons applied
- Clicks on the help buttons
- Conversations started
- Conversations started from a starter, a subset of Conversations started
- Clicked content block
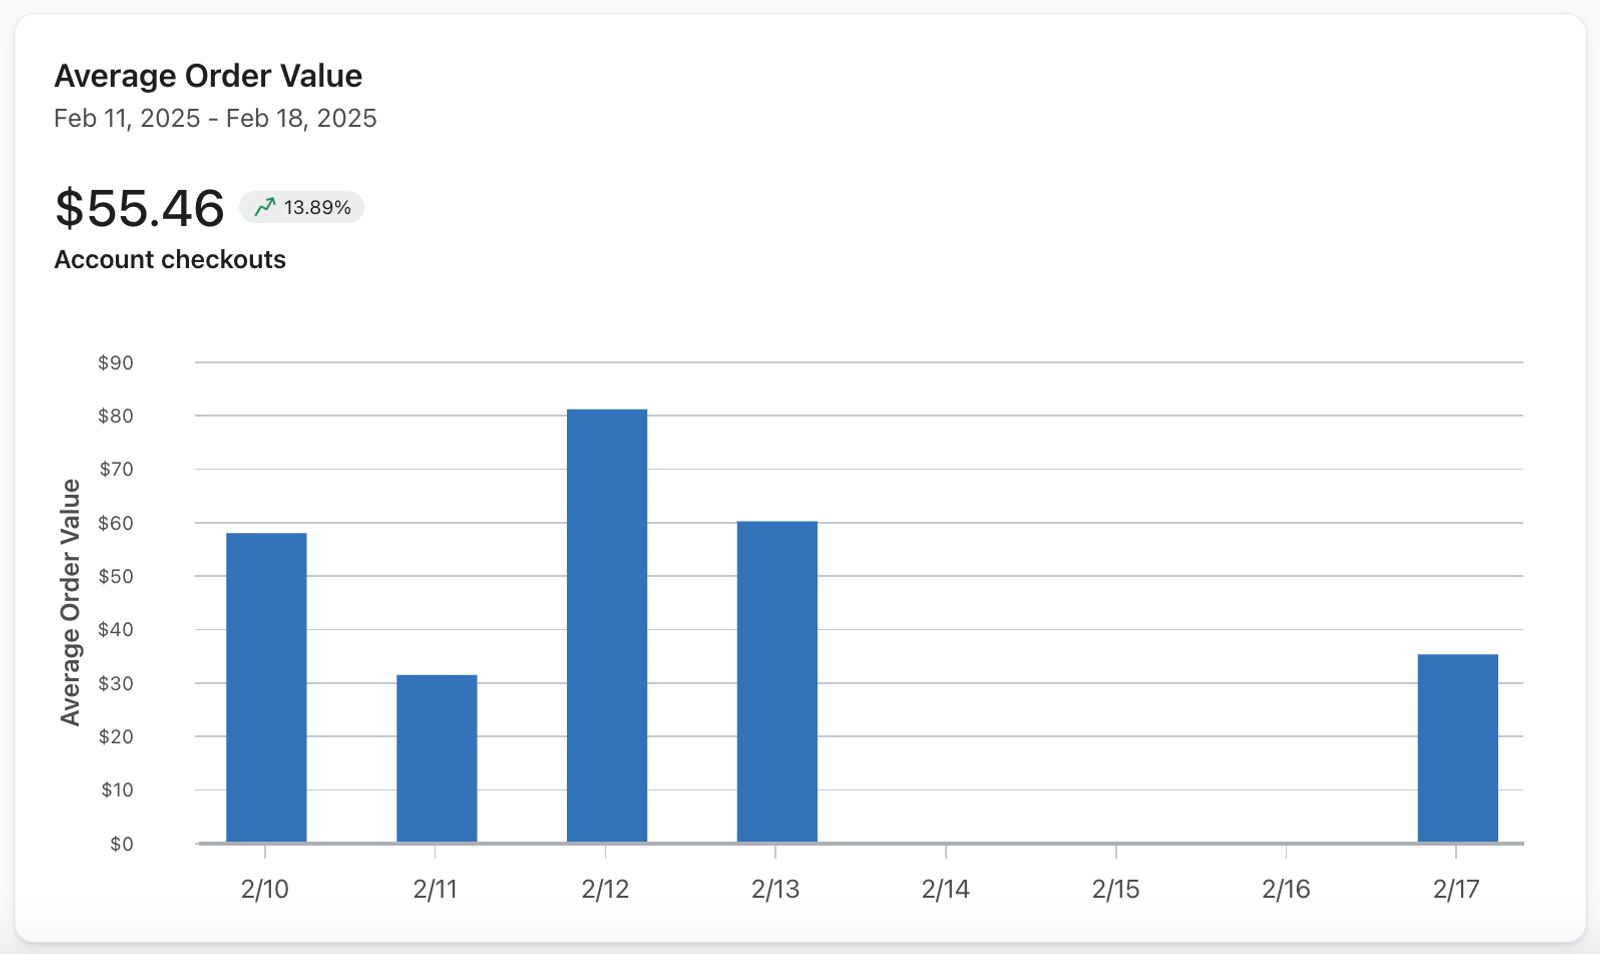
Average order value
The Average order value section displays the average order value for customers with Customer Hub accounts, including the amount and change from the comparison period. It does not require the customer to be signed in during checkout.
This section also includes a graph of average order value over time for customers with Customer Hub accounts, so you can track their spending trends.
Content block analytics
The Content blocks section helps you understand how customers engage with your customizable content blocks. Learn more about content blocks.
- Block name
Shows the internal name of the block, which is configured in the Design page of Customer Hub when you add a new content block. This name is internal-only and cannot be changed in order to preserve continuity in reporting even when you edit the content.
- Unique clicks
Shows the number of unique shoppers who clicked the block in the selected time period. Each shopper is counted once, even if they clicked more than once.
- Click through rate
Shows the percentage of unique viewers who clicked the content block in the selected time period. More targeted content blocks reach fewer visitors, but targeting does not guarantee a higher click through rate.
Favorites analytics
The Favorites section helps you understand how customers engage with your products through Favorites and the revenue impact of the Favorites extension.
- Active Favorites accounts
View the number of unique customers who added a product to Favorites during the selected period, with period-over-period trends to track adoption. - Revenue generated
See product revenue attributed to clicks or adds to cart from Favorites within the 24-hour attribution window, with a comparison to the selected comparison period. Saving a product to Favorites alone does not attribute revenue. - Top favorited items
A table showing the 3 products added to Favorites by the most unique customers during the selected period, including product images and names. This helps you identify which items resonate most with customers and may inform inventory, marketing, or merchandising decisions.
What to do if your data seems stagnant
If your data seems stagnant, it may indicate that customers are not logging in or fully understanding the benefits of accessing your Customer Hub interface. This can hinder your ability to personalize experiences and encourage repeat business.
To encourage your site visitors to engage with their accounts, try the following strategies:
- Re-engage inactive customers
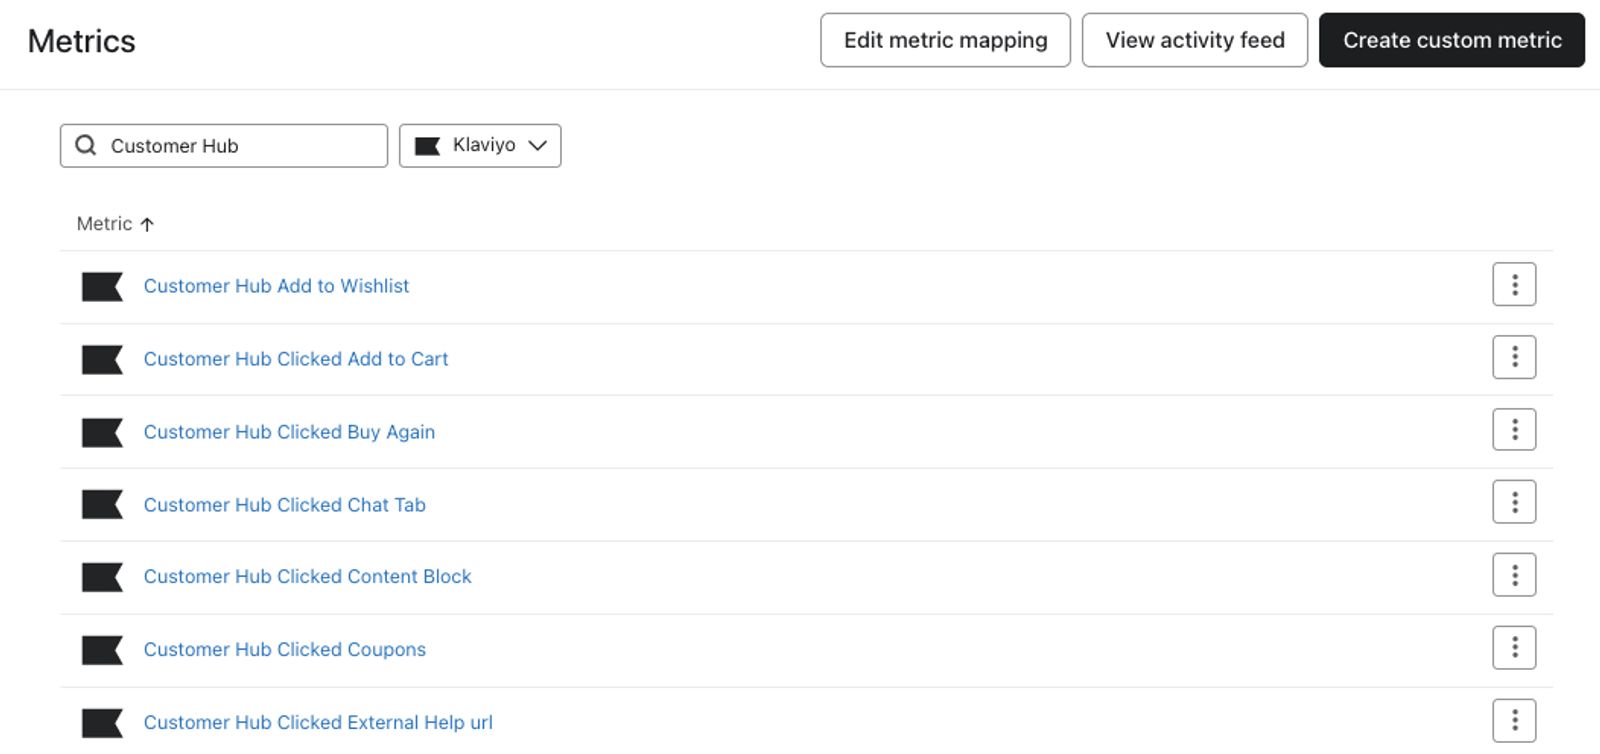
- Send targeted emails or SMS messages to reconnect with customers who haven't logged in recently. You can build a segment using the Customer Hub Login metric. Note that you can view all metrics relating to Customer Hub on the metrics page in Klaviyo to inform your messaging strategy.
- Send targeted emails or SMS messages to reconnect with customers who haven't logged in recently. You can build a segment using the Customer Hub Login metric. Note that you can view all metrics relating to Customer Hub on the metrics page in Klaviyo to inform your messaging strategy.
- Increase customer engagement and incentivize log-ins:
- Create content blocks to display in your Customer Hub interface that promote exclusive benefits for members, such as early access to sales or information about your rewards program.
- Show product recommendations to shoppers in the Customer Hub interface for an additional layer of personalization.
Additional resources
- Getting started with Customer Hub on Shopify
Learn about Customer Hub, a unique personalized experience for online store visitors that guides them from product discovery through purchase and post-purchase support.
- How to display product recommendations in Customer Hub
Learn how to display personalized product recommendations in the Customer Hub drawer to tailor shopping experiences for your customers and drive conversions. By showing products that appeal to customers, you can improve conversion rates and provide cross-sell opportunities to increase average order value.
- Getting started with flows
Learn how to use flows, also known as automations or drip campaigns, in Klaviyo for personalized and automated communications to your customers, and learn how to set your first flow live.