How to use the email campaigns trend report
You will learn
Learn how to find the email campaigns trend report and what is included in it. This report allows you to track how your campaigns are performing in the aggregate, which provides a big-picture view of how your clicks, open rates, and recipients change over time.
Locate the email campaigns trend report
- Navigate to the Campaigns tab.
- Click the 3 vertical dots at the top of the page.
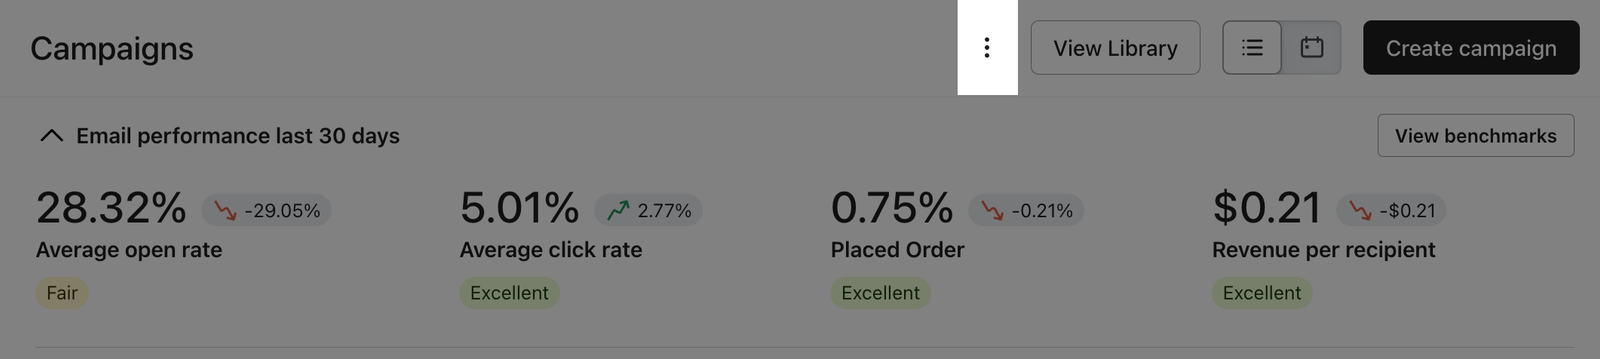
- From the dropdown, click Email trends.
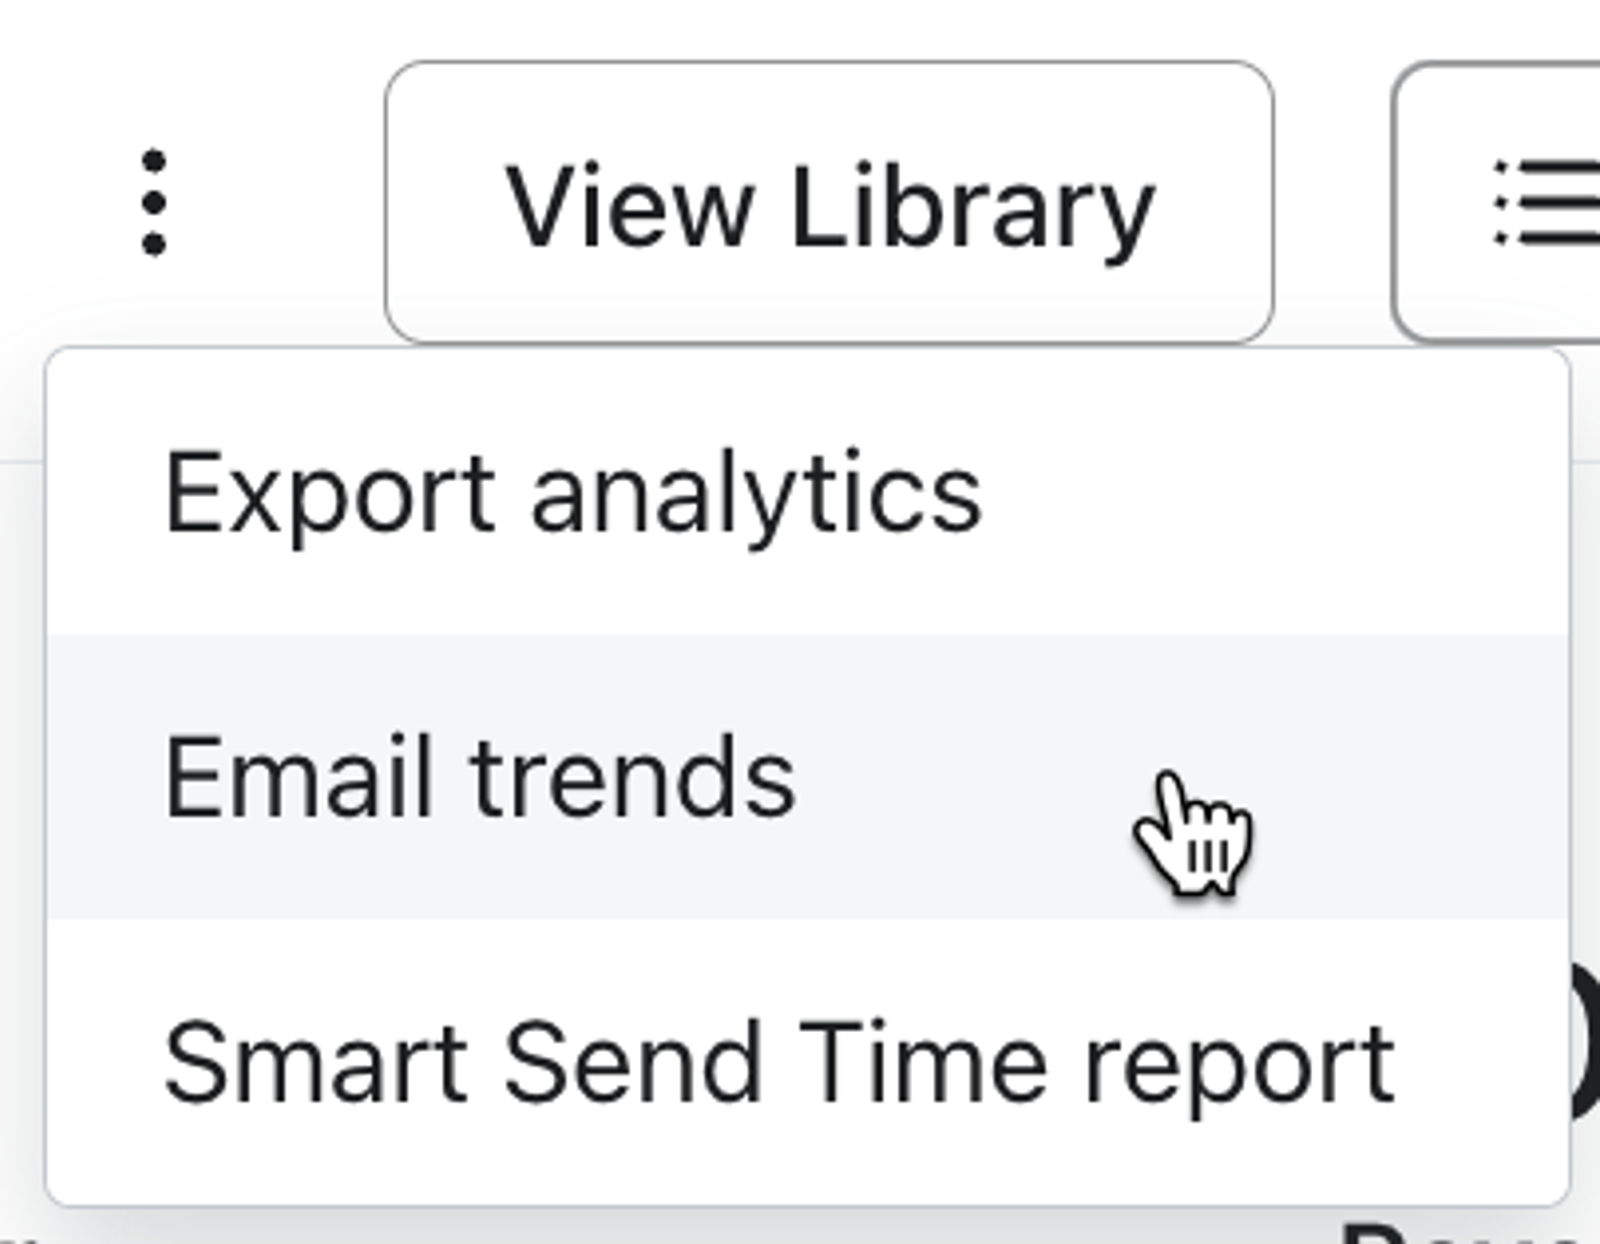
Each report section opens in Chart view. Select Table in a section to see campaign names, send dates and times, lists, and metric values. Click a column heading to sort the table or a campaign name to open its report.
Metrics included in the report
These are the metrics you’ll see in the report for each campaign:
- Recipients: the number of recipients for the campaign.
- Opens: the unique number of opens for a campaign.
- Open Rate: the unique number of opens divided by the number of delivered emails.
- Clicks: the unique number of clicks you’ve received for a campaign.
- Click Rate: the unique number of clicks divided by the number of delivered emails.
- Spam Complaint Rate: the unique number of spam complaints divided by the total number of delivered emails.
- Bounce Rate: the number of bounced emails divided by the total number of sent emails, including bounces.
- Conversion rate: the number of unique conversions attributed to a campaign divided by the number of delivered emails. The label uses your selected conversion metric, such as Placed Order Rate.
- Conversion value: the sum of the monetary values of conversions attributed to a campaign. This appears when your selected conversion metric has a value, with a label such as Placed Order Value.
If you are using the feature to exclude bot clicks, the email campaigns trend report excludes bot clicks from its click counts and click rates. Learn more about bot clicks and how they are tracked in Klaviyo.
Report filtering
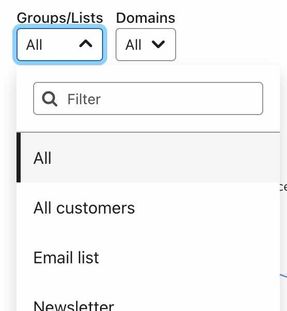
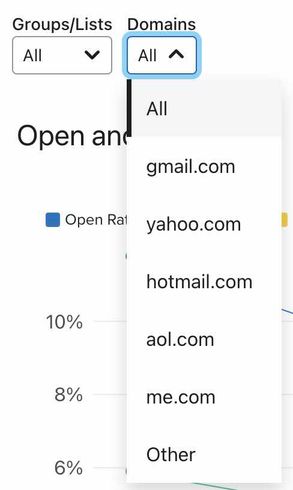
You can filter the report using Groups/Lists for a list or segment, Domains for an email domain (Gmail, Yahoo, etc.), and Campaign Count for the last 5, 20, or 50 campaigns.
Use Groups/Lists to select campaigns sent to a specific list or segment. For example, you may want to compare a segment of recent purchasers to your main subscriber list. This filter is designed to make it easy to compare the performance of lists or segments that you send to regularly. It shows results for the whole campaign, including any other lists or segments the campaign was sent to.
Analyzing trends by email domain gives you a sense of which domain your most active subscribers are using. Select a domain under Domains to filter engagement results. Recipients still shows the campaign’s total recipient count. Set Domains to All to view conversion value.
Lastly, you can look at how your past 5, 20, or 50 campaigns have performed. Please note that this metric is the number of campaigns, not days.

Open and click rates
Open, click, and conversion rates are graphed separately, which allows you to view them alone or in relation to one another. When you hover over a point on the Open and Click Rates graph, you’ll see the open rate, click rate, and conversion rate for a particular campaign.
You can use this chart to see how differences in your campaigns impact open, click, and conversion rates. For example:
- Test sending on certain days of the week.
- E.g., do campaigns sent on Mondays have higher open rates than those sent on Wednesdays?
- Test subject line or email content.
- E.g., do certain types of emails have higher open or click rates than others?
- See how a specific email domain is performing over time.
- E.g., are Gmail open rates going up? Does this differ from Yahoo open rates?
- Analyze and compare the performance of specific lists.
- E.g., are newsletters sent to a weekly recipient list more successful than a daily one?
- Test send times.
- E.g., do campaigns sent in the morning have higher open rates than those sent in the afternoon?
Total opens, clicks, and recipients
When you hover over a point on the Total Opens, Clicks, and Recipients graph, you see the number of recipients, unique opens and clicks, and conversion value when available. All series use the scale on the right.
Select Table to see the send date and time, along with the list or segment associated with each campaign. This view lets you compare campaign recipient counts and engagement totals over time. It does not measure the full size of a list.
With Groups/Lists set to All, the List column shows a list or segment associated with each campaign. If a campaign was sent to multiple lists or segments, only one is shown.
- See how opens, clicks, and conversion value change with the number of campaign recipients.
- See which campaigns are the most lucrative by looking at your conversion value.
Spam and bounce rates
When you hover over a point on the Spam and Bounce Rates graph, it shows the spam complaint rate and the bounce rate. Both rates use the scale on the right.
These numbers should be very low and give you insight into the quality of your list. Your spam rate should be lower than 0.1% and your bounce rate should be lower than 2%.
Select Table to see the date and time the campaign was sent.
- View this report on a per-list basis to see which lists may need cleaning.
- Identify problematic campaigns and reassess the content you’re sending.
Additional resources
- Getting started with reporting
Learn about the different robust Klaviyo reporting tools available in your account. Klaviyo is built to help your business grow and strengthen your relationships with your audience by putting data to work. Segmentation and automation tools allow you to personalize and target your communication efforts across channels to boost engagement and drive business growth. However, in order to understand how well your business strategies and marketing efforts are working, you need proper reporting to measure and analyze performance trends over time.
- How to increase campaign open rates
Learn best practices around improving low open rates so that you can grow as a brand without harming your sender reputation. Open rates allow you to measure customer engagement and monitor your deliverability and performance. When you send a campaign that results in a critically low open rate, Klaviyo will alert you, prompting you to refine your sending habits.