Getting started with Report builder (in beta)
Available to customers with Advanced KDP or Personalization access.
Overview
The new Report builder is the next generation of Klaviyo’s custom reporting experience. Built on Klaviyo’s Data Dictionary and a vastly more scalable infrastructure, it provides a flexible, consistent way to create and customize performance, product, and metric reports — all in one place.
With Report builder, you can:
- Build reports using Campaigns, Flows, Forms, Products, or Metrics (events) data from any integration
- Combine Campaigns and Flows data in a single marketing performance report
- Use multiple groupings and add up to 20 filters
- Group by custom profile and event properties
- Export data to CSV, or schedule your reports to run on a recurring basis
- Start from a pre-configured “quick start” template and easily customize the report further to your needs
Report builder is currently in beta and available to all active and trial Advanced KDP and Personalization customers.
Key improvements from Custom Reports
Report builder was rebuilt from the ground up to offer more flexibility, data consistency, and control.
Overall here is how Report Builder’s capabilities compare and have been improved:
Capability | Custom Reports | Report builder |
Data contexts | Campaigns, Flows, Products, and Metrics | Campaigns, Flows, Campaigns and flows, Forms, and Events (including product events) |
Filtering | Filtering varies by report type: tag filters for campaign and flow reports, up to 10 filters for metric reports, and 1 filter for product reports. | Up to 20 filters |
Grouping | 1-2 grouping options | Multiple message attribute groupings, up to 5 metric property groupings, and up to 2 profile property groupings, within a maximum of 50 columns per report. |
Profile & event properties | Only supported in Metric reports | Use available profile properties across report types. Connect custom profile properties before selecting them. Metric property groupings are available for campaign, flow, combined campaign and flow, and event data. |
Scheduling | Schedule a report to run weekly or monthly at a certain date-time | Schedule a report to run weekly or monthly at a certain date-time, and customize the send timezone, subject line and message |
Templates | Standard report types and legacy prebuilt report templates library | Standard report templates use your mapped conversion metrics where applicable. |
Export | CSV only | CSV only |
Capabilities by report type
Each report type has different supported data contexts and grouping options.
Report Type | Custom reports | New report builder |
Campaign data |
|
|
Flow data |
|
|
Metric data |
|
|
Form data |
|
|
Product data |
|
|
Profile data |
|
|
You can now group by profile attributes (e.g., City, Current RFM Group, and your own brand-specific custom profile properties) across any of the report types — an experience not previously possible in Custom Reports.
Access Report builder
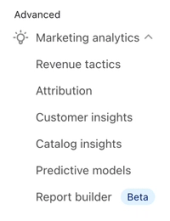
- Navigate to Advanced > Personalization > Report builder.
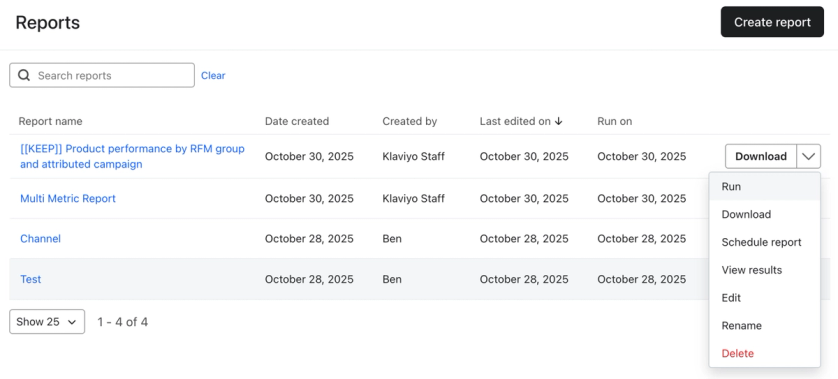
The Reports page lists all your saved reports. From this page, you can:
- Create a new report
- Download it to CSV
- Schedule it for recurring delivery
- Run, edit, or rename a report
- View up to 100 rows of results from the most recent run
- Delete a report
Create a new report
- Click Create report to open the Create a report drawer.
- Give your report a name and, optionally, a description. Choose Campaign performance, Flows performance, Metric report, Product performance, or New vs. returning performance, or select Custom report to build from scratch.
- Click Create report in the drawer to open the report editor.
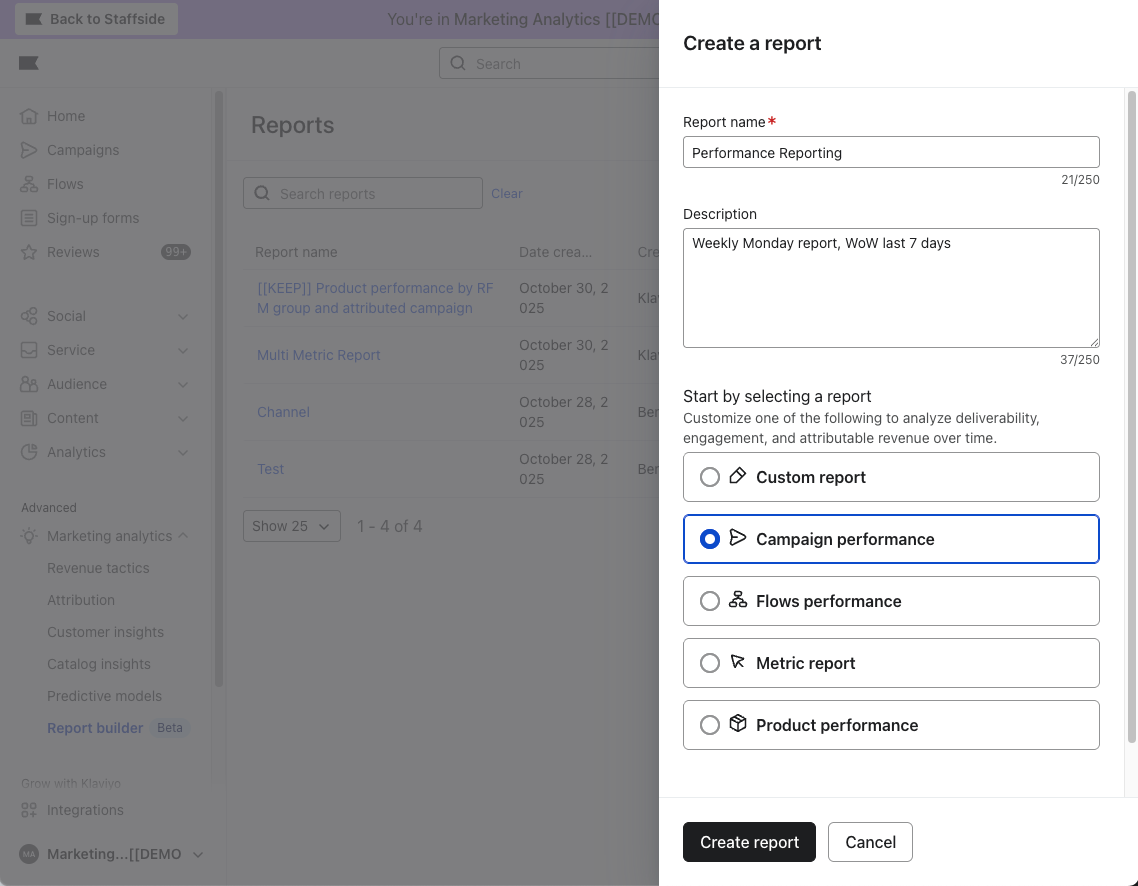
Templates start with a standard configuration. Campaign performance and Flows performance use your mapped revenue metric (e.g., Placed Order), while Product performance uses your mapped Ordered Product metric. New vs. returning performance requires a mapped revenue metric. If a mapped metric is missing, select a metric in the editor or map it in Metrics. Metric report and Custom report require you to select your data.
Configure your data
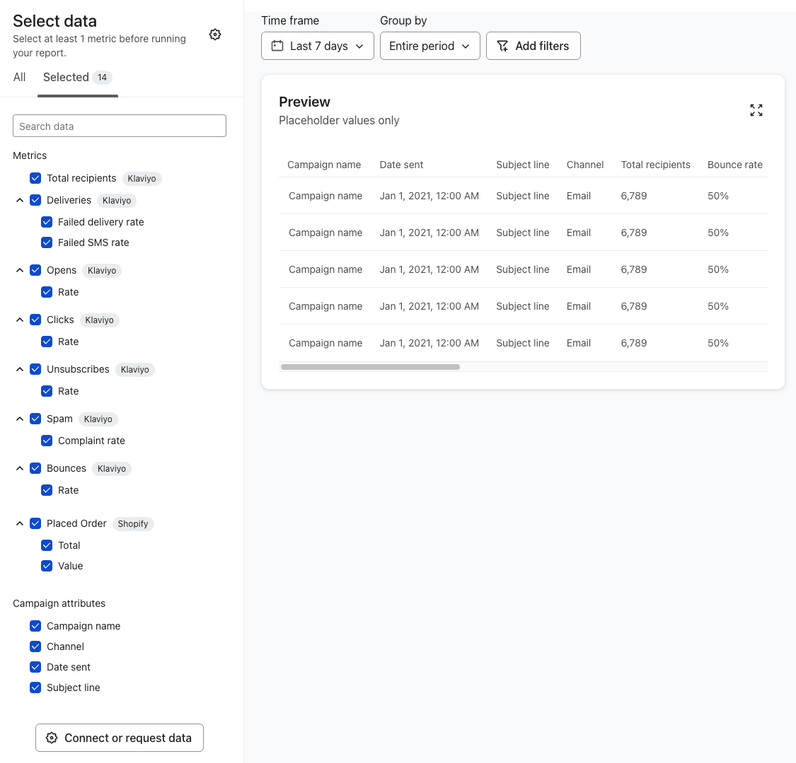
The report editor includes the Select data panel.
- Use the Selected tab to see the pre-selected metrics and attributes included by default for your chosen report type.
- Select the All tab to explore and add metrics and groupings. For a Custom report, choose a Select data source option, such as Forms or Campaigns and flows.
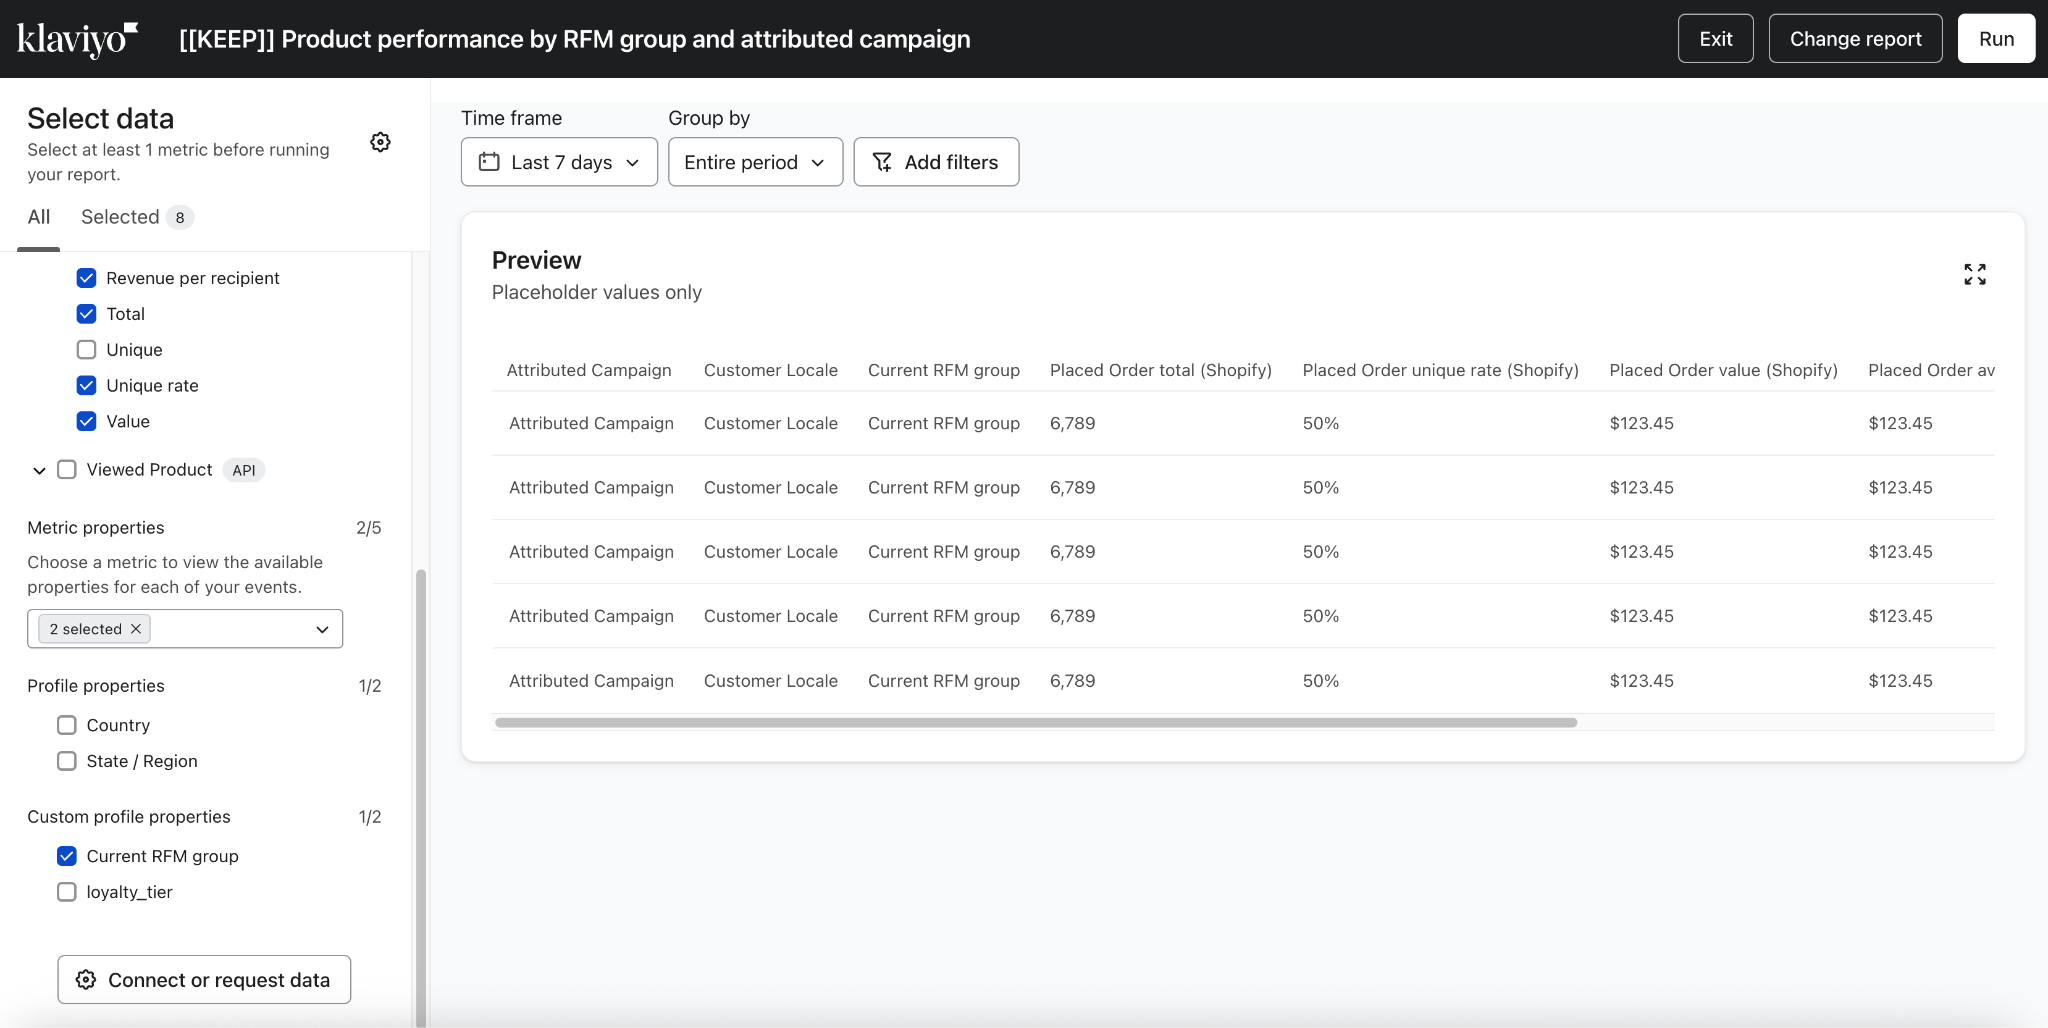
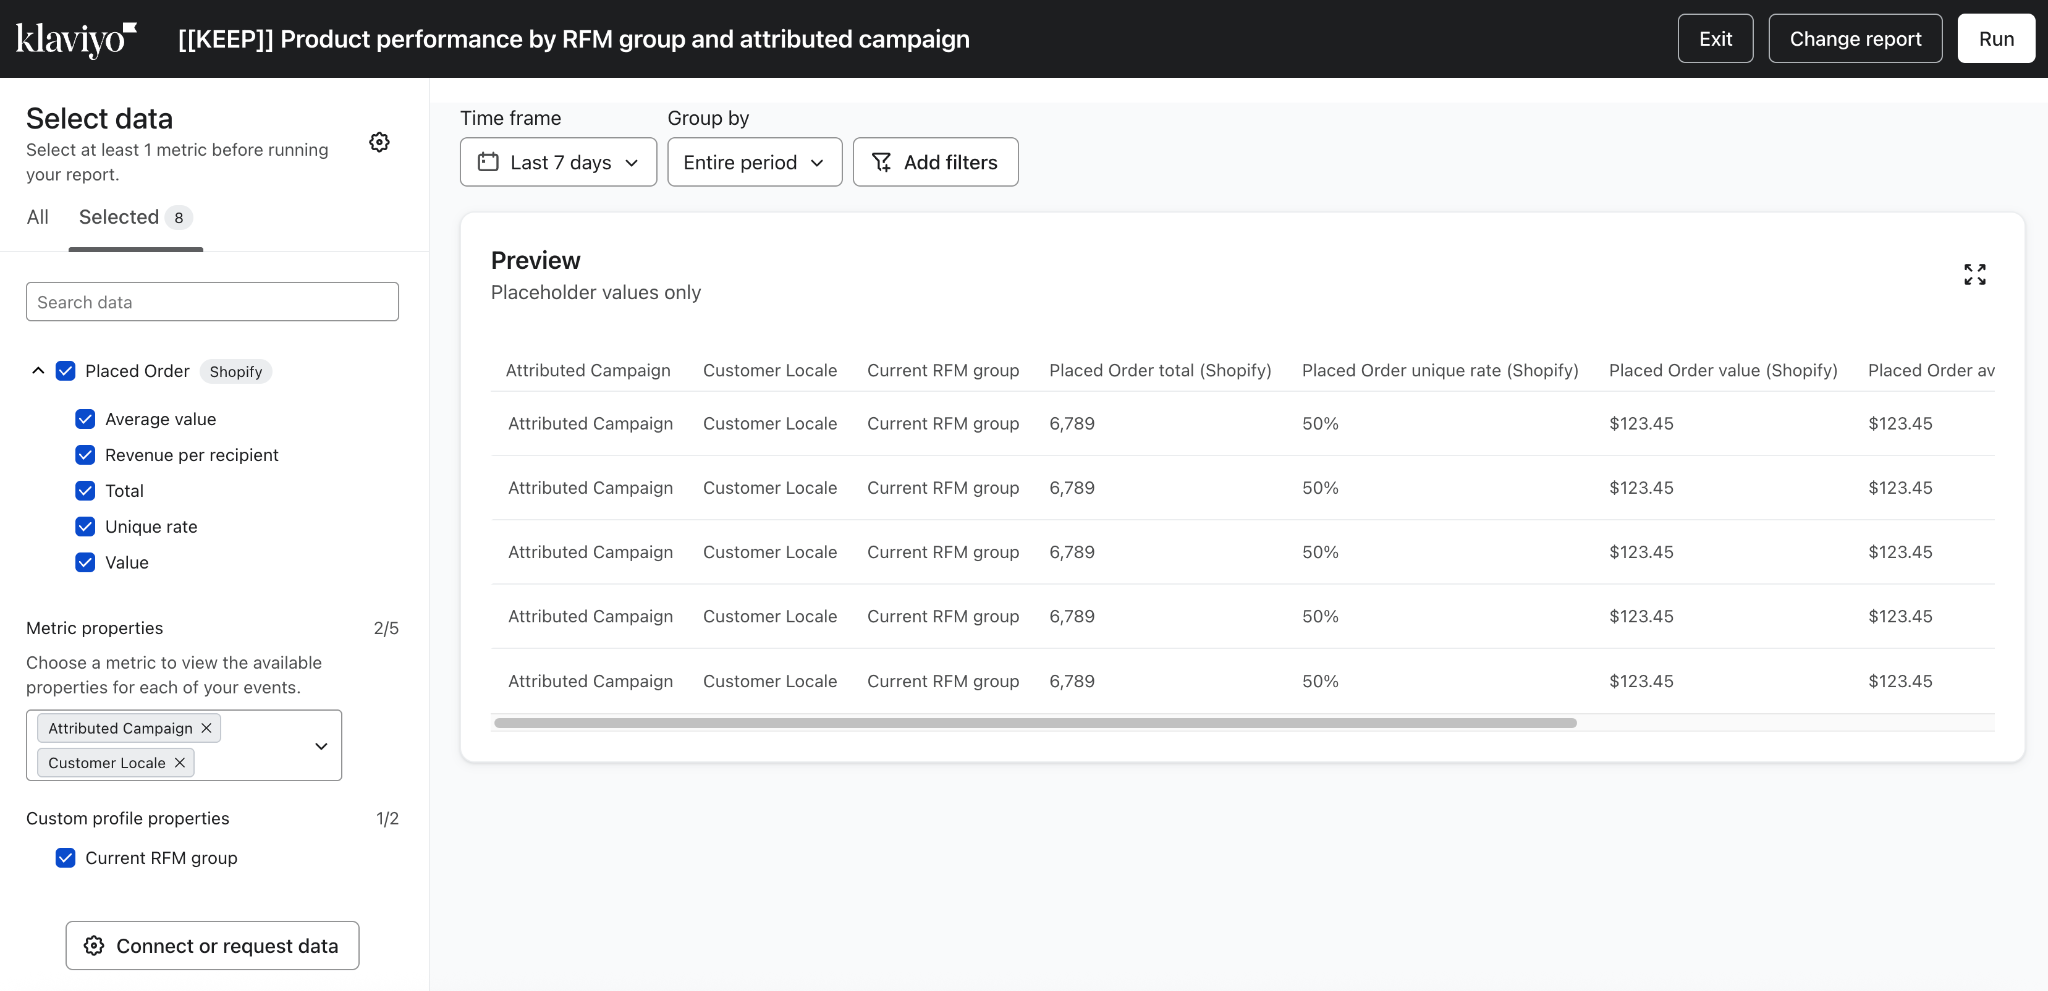
- Choose metrics such as Opens, Clicks, or Placed Order, and the measurements available for each metric, such as Total, Unique, Unique rate, Average value, or Revenue per recipient.
- You can add additional groupings by selecting attributes like campaign name, channel, text message format (e.g. SMS, MMS, RCS), A/B test variation, inbox provider, country, current RFM group, and more. Once you export your data to CSV, you can use these groupings to pivot your data to create unique, nested views.
You can select up to 50 columns per report, including up to 5 metric properties and 2 profile properties. Built-in and custom profile properties count toward the same 2-property limit.
To use a custom profile property that is not yet connected:
- Click Connect or request data, then Connect new property.
- Select the property and wait for the check to finish. If it cannot be connected, choose another property or use Request data.
- After the property is connected, close the drawer and select it under Profiles in Select data.
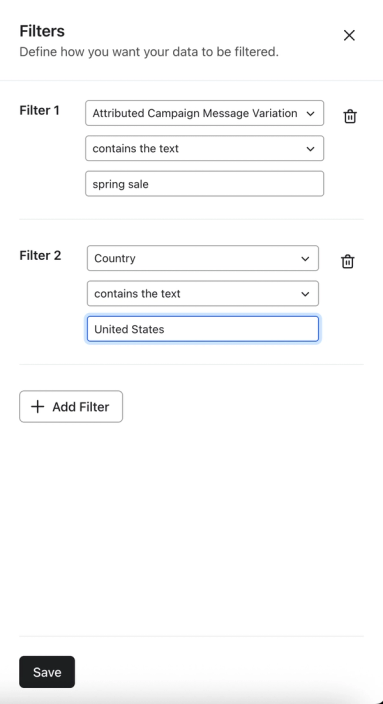
- Click Add filters, then Add Filter. Select a Property, Operator, and Value, then click Save. You can add up to 20 filters, using a different property for each filter. Available operators depend on the property.
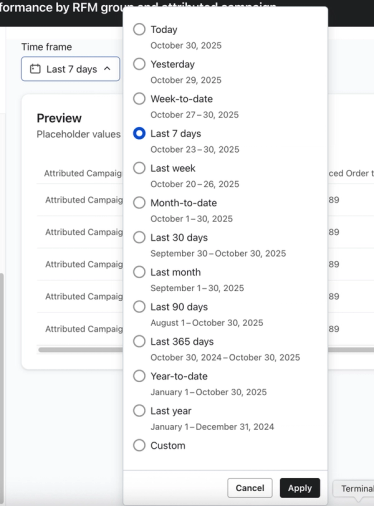
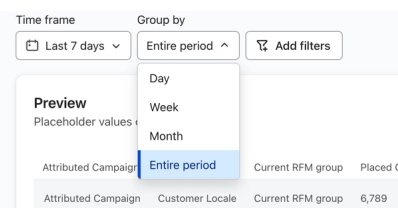
- Choose a Timeframe, such as the last 7 or 30 days. Use Group by to choose Entire period, Day, Week, or Month.
For a custom date range, the maximum span is 365 days when grouping by Day or Week, and 730 days when grouping by Month or Entire period.
Preview and run your report
The editor’s Preview shows placeholder values. Run the report to see your data.
- When you’re ready, click Run to save your configuration and generate the report.
- Report builder displays a preview of up to 100 rows from the completed report. Download the CSV to see the full results.
- While your report runs, you’ll see a progress animation showing each stage (data retrieval, organization, export preparation).
- Once the report is complete, you can download the data as a CSV, schedule it, or view it in the app.
Schedule or export your report
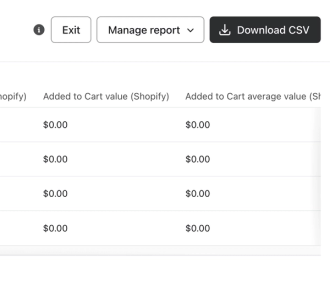
To export the full results after a report finishes, click Download CSV on the results page.
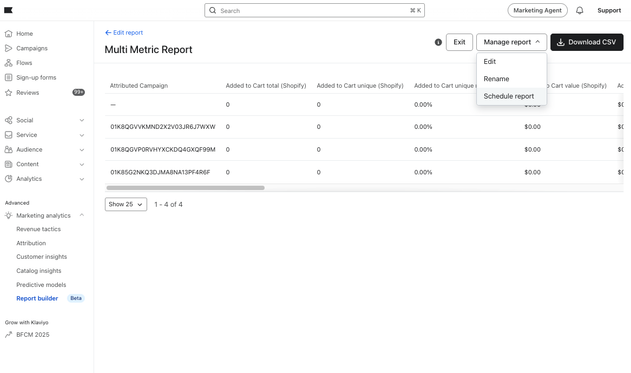
From your report’s Manage report menu, you can:
- Edit your configuration
- Rename your report
- Schedule recurring delivery via email
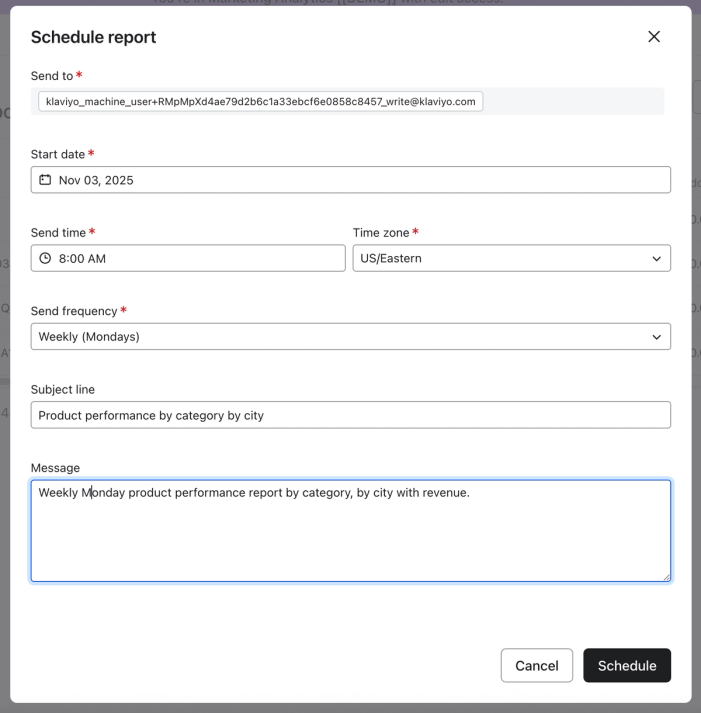
When scheduling a report:
- New schedules send to your user email address. The Send to field is read-only. If an existing schedule sends to another user, click Switch to me to receive it yourself.
- Select your Start date, Send time, Time zone, and Send frequency (weekly or monthly).
- Customize the Subject line and Message, then click Schedule.
Report builder can help you answer real questions:
- Compare engagement and conversion rates by channel across all campaigns and flows.
- Analyze Placed Order and Added to Cart metrics by attributed campaign.
- View form submissions by version and region to optimize signup performance.
- Identify top-performing products by campaign or by RFM group
- Group purchase behavior by custom profile attributes like membership tier or loyalty status.
Next steps
- Build and use custom reports in Report builder
- Provide product feedback via the product feedback form, your Customer Success Manager or support@klaviyo.com