How to change the conversion metric for flow and campaign reports
You will learn
Learn how to change the metric for flow and campaign conversions when analyzing results across your account.
Different marketing efforts have different calls-to-action (CTAs), and as a result, some messages may be revenue-driven while others are meant to drive a different type of conversion. When you send a campaign or set an automated flow live, Klaviyo automatically tracks attributions across all metrics in your account. This means you can easily see how your messages perform across different activities (e.g., placed orders, checkouts started, website activity, etc.).
Campaign conversions
- Head to the Campaigns section.
Here you will see a snapshot of how your most recent campaigns performed. You will see the open and click rates for each campaign, and then you will see a third column to see a conversion metric of your choice. - To adjust this third column, open the conversion metric dropdown (to the left of the search campaigns field).
- Choose which conversion metric you want to see the performance of. Note this will be a mix of Klaviyo and integration-specific conversion metrics.
Once you have chosen your metric, it will appear in the last column to the right.
Flow conversions
1. Toggle the conversion metric for a given flow email by using the Conversion metric dropdown, as shown below.
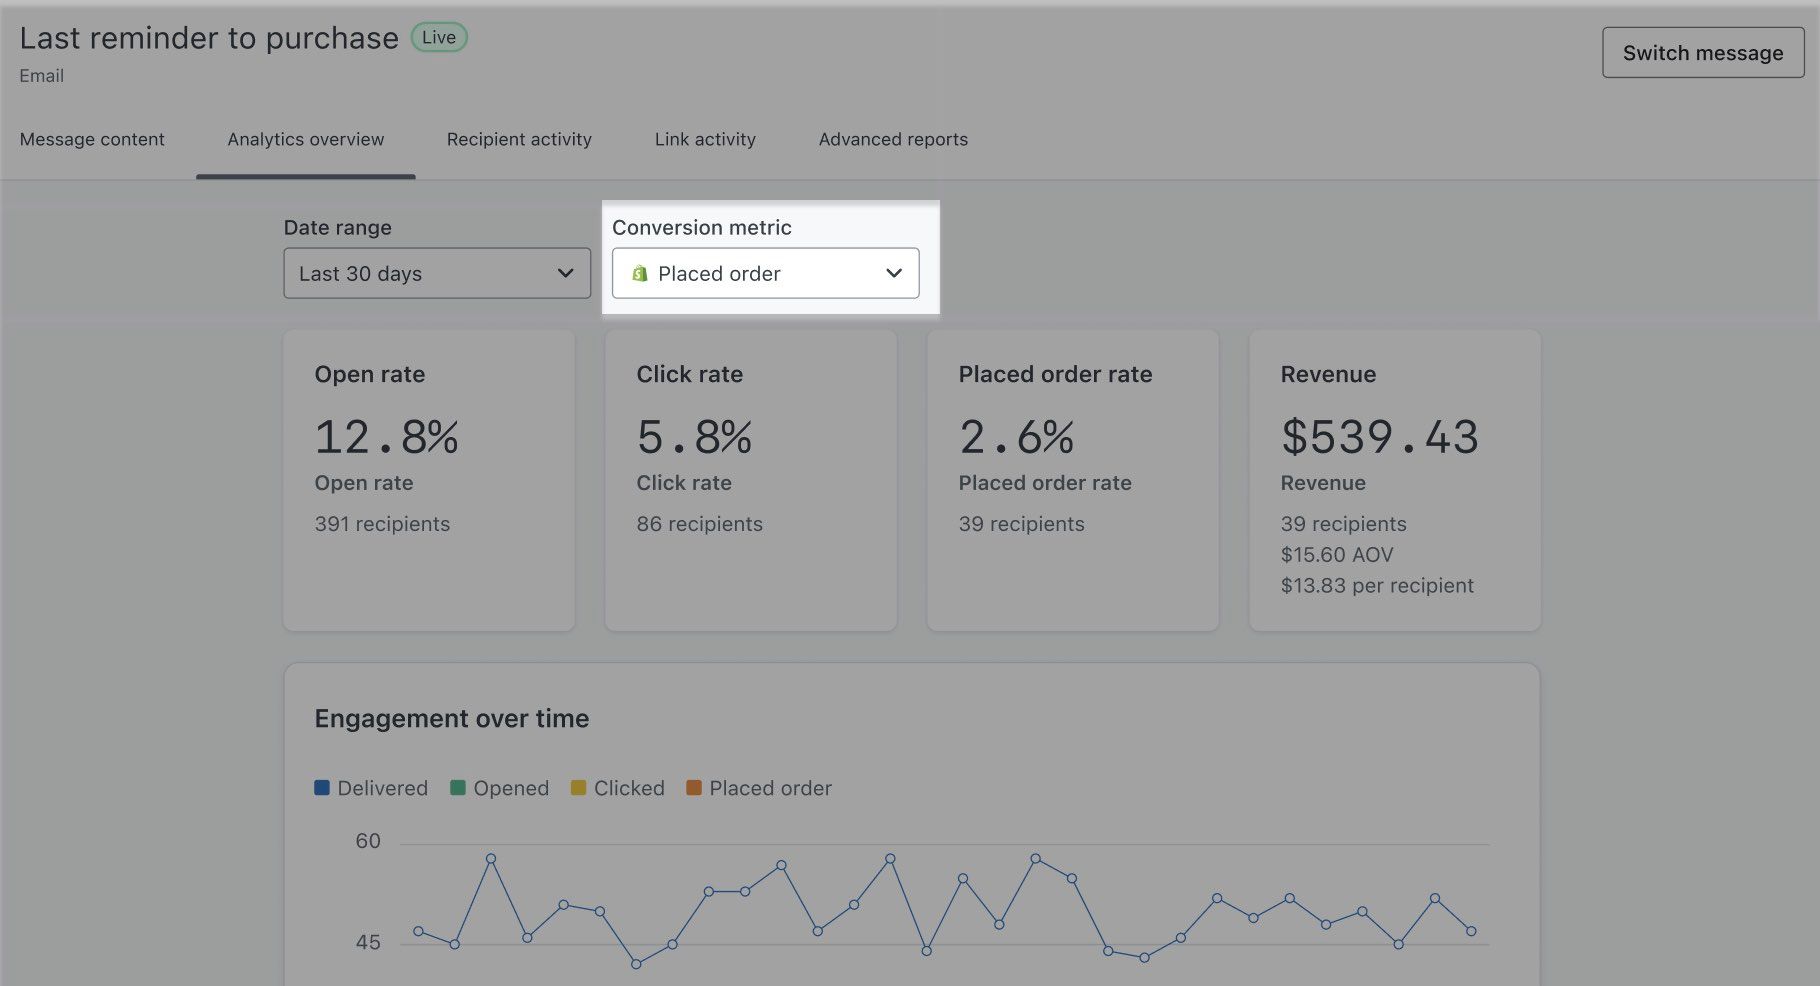
2. Select a specific metric you'd like to view conversion for. The metric you choose for a given flow email will populate across the overview reports for all flow emails and will alter the 30-day snapshot you see when looking at the full flow. You can change this conversion metric at any time.
Custom reports' data
Custom reports allow you to conduct an in-depth analysis of how your business performs over time with pre-built, customizable reports. There are two custom reports that focus specifically on campaigns and flows: the Campaign Performance Report and the Flows Performance Report.
1. To adjust the conversion metric in these reports, click into the dropdown under Conversion Metric.
2. Select the metric you want to focus on.
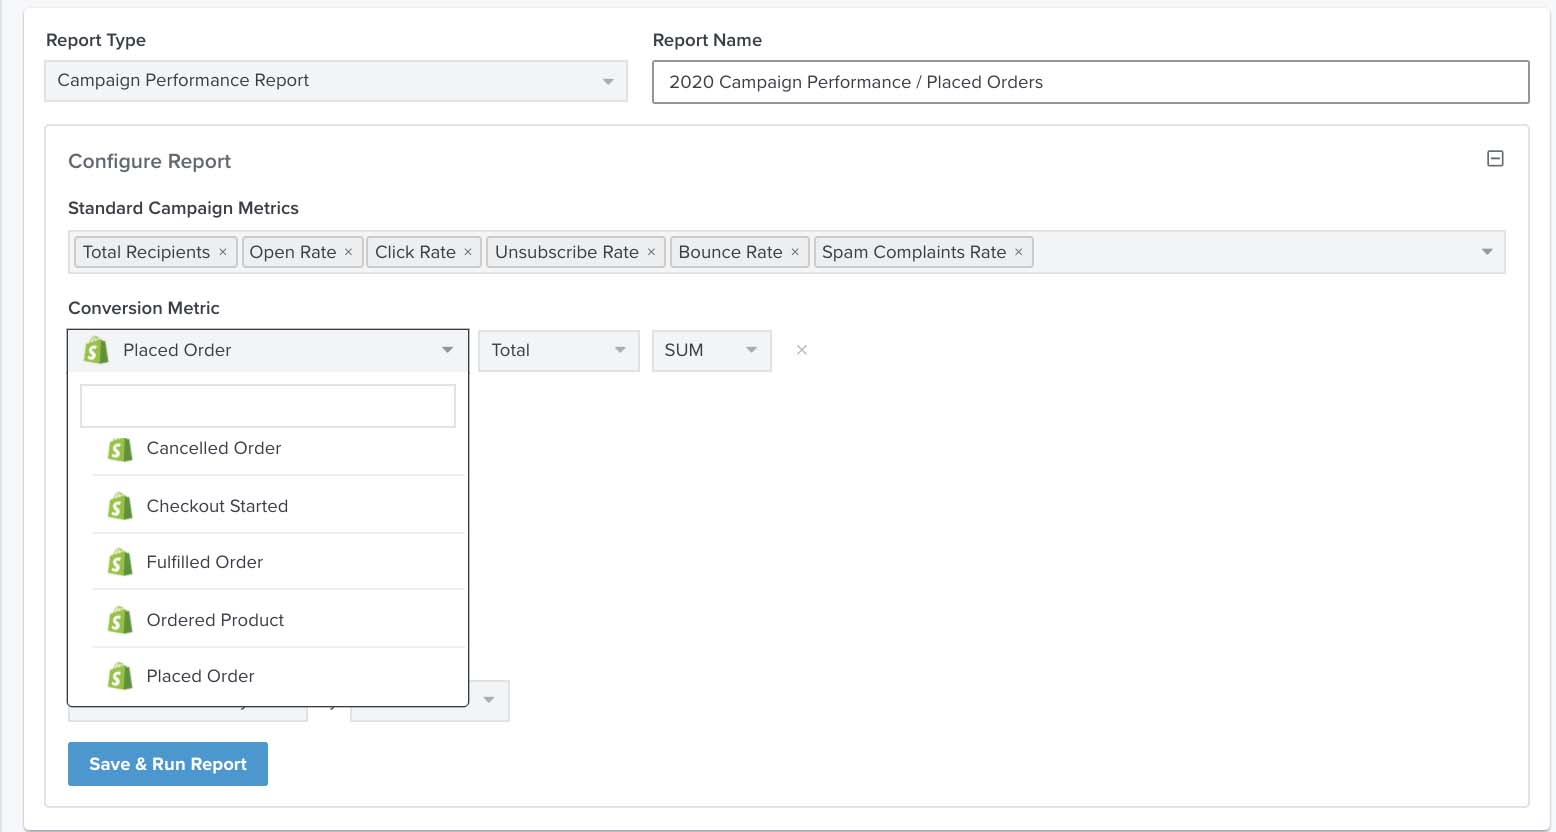
You can then decide how to analyze this conversion metric. With the exception of rates, all conversion metrics support two different dropdowns to customize your analysis:
- Total, Unique, or Value
You can report on the total number of instances of an event (TOTAL) or the unique number of profiles that performed that event (UNIQUE). If the metric you select has a monetary value associated with it (e.g., Placed Order), you can also report on the value of the events (VALUE). - SUM or AVG
You can choose one of two aggregations: SUM or AVG. SUM shows you the total of all events for your selected metric. For example, if there are two Placed Order events within the timespan you select, both with a $15 value, the VALUE SUM will be $30 and the TOTAL SUM will be 2. AVG shows the average of events that occurred for your metric. For example, if there are two Placed Order events within the timespan you select, both with a value of $15, the average will be $15.
Additional resources
- Email metrics reference
Learn more about what specific metrics in Klaviyo are associated with your customers' interactions with your emails. Understanding the metrics in your account is crucial to gaining insight into how your marketing initiatives are performing.
- Understanding SMS metrics
Learn about the SMS metrics that are pulled into Klaviyo, such as what they are, where to find them, and what they mean.