How to review email A/B test results for flows
You will learn
Learn how to review A/B test results for flow emails and what each indicator on the results page means.
A/B testing flow messages can provide valuable insight into your audience. Klaviyo makes determining what changes you should make to your sending strategy simple. Not only will you know the winning variation for an A/B test, but also other important factors, such as winning metric details.
View the A/B test results page
The option to view test results will only appear for tests that have been published - this includes tests that are currently running and those that have completed. To learn more about creating and publishing a test, please see our article on how to A/B test a flow email.
To view the results of a test while it is running or after completion, follow these steps:
- Click an email within the flow builder that has a published A/B test.
- In the right details sidebar, click View test for a running test or View A/B test for a completed test.
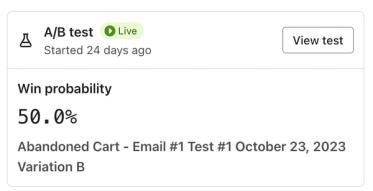
You will automatically be taken to the A/B test results tab, where you can see the results for the current or most recent A/B test.
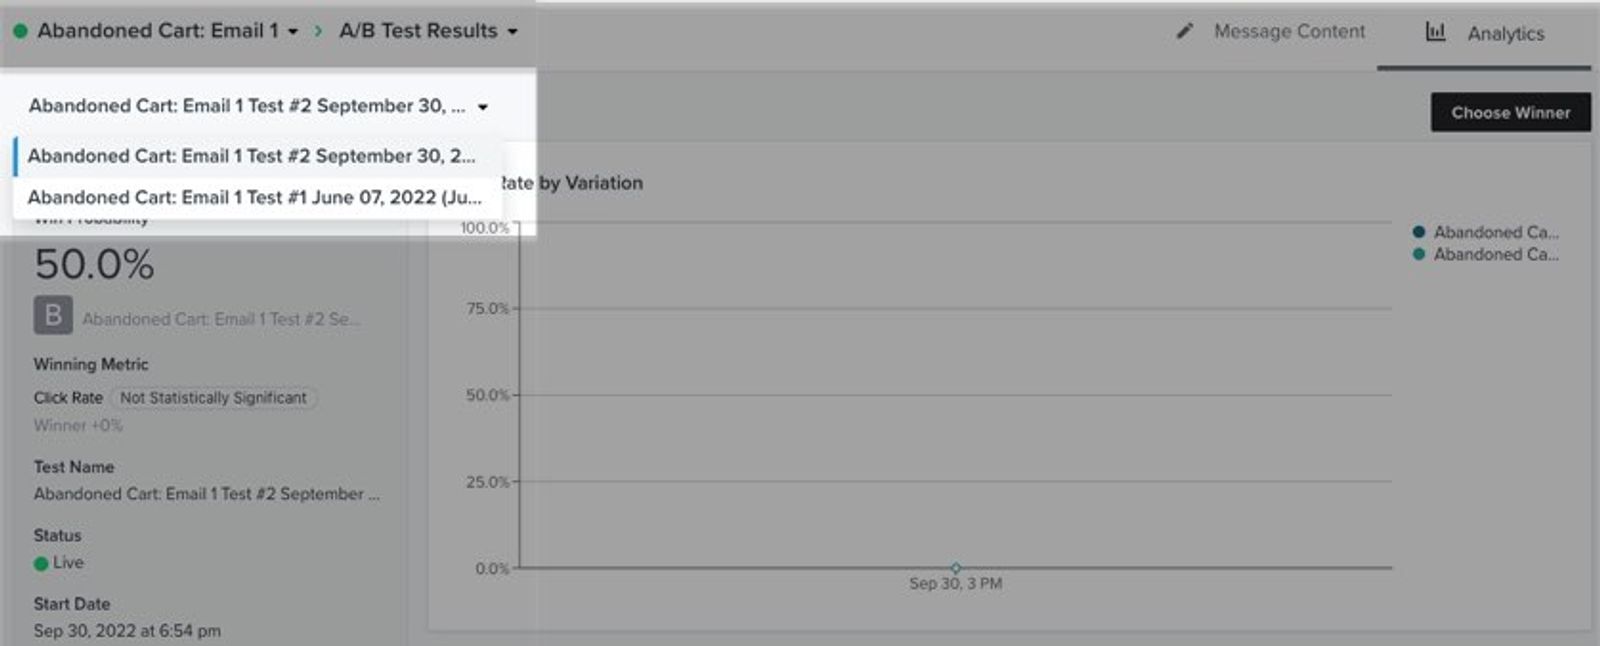
If you want to view the results for previous tests, open the test name dropdown on the top left of the page and choose the name of a previous test to view its results, as shown below.
The results page is broken into two parts:
- Test Overview
- Variations
Test overview
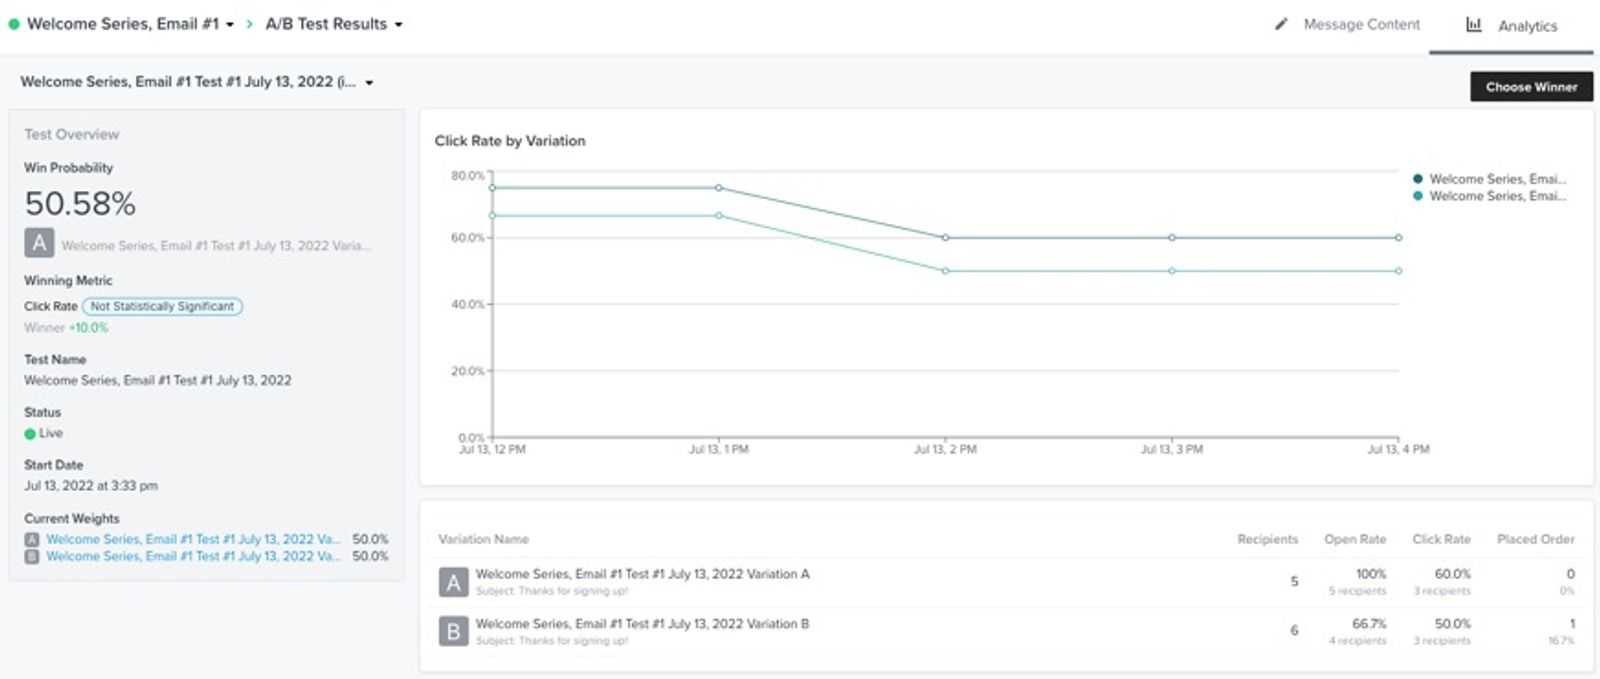
In the Test Overview section, you’ll see a snapshot of the test results.
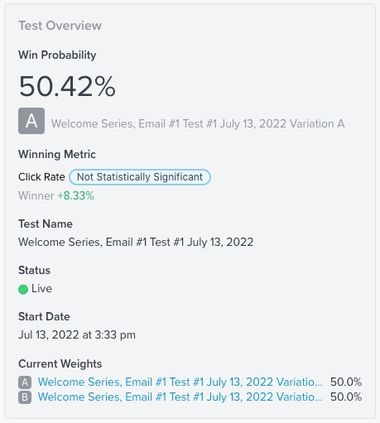
The following sections will appear for currently running tests:
- Win Probability
Which variation is likely to win and the percent likelihood that a given variation has of winning - Winning Metric
The metric selected during test setup (either Click Rate or Open Rate), whether the results are statistically significant, and the difference in percentage points between the 2 highest-performing variations for that metric - Test Name
Name of the test you are viewing results for - Status
Whether the test is running or completed - Start Date
Date and time the test started in your account’s configured timezone - Current Weights
The percentage of recipients currently assigned to receive each variation. If you selected automatic distribution, these percentages can change as the test runs.
The following sections will show for completed tests:
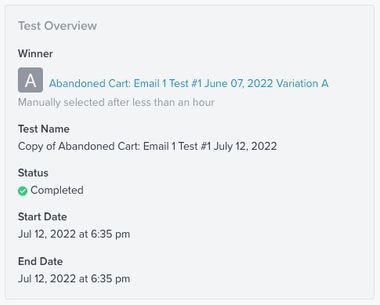
- Winner
The variation selected as the winner, either automatically based on the winning metric or manually. The result indicates when the winner was manually selected. - Test Name
Name of the test you are viewing results for - Status
Whether the test is running or completed - Start Date
Date and time the test started in your account’s configured timezone - End Date
Date and time the test completed in your account’s configured timezone
Variations
In the Variations section, you’ll see a chart of the winning metric over time for each variation and a table comparing the variations.
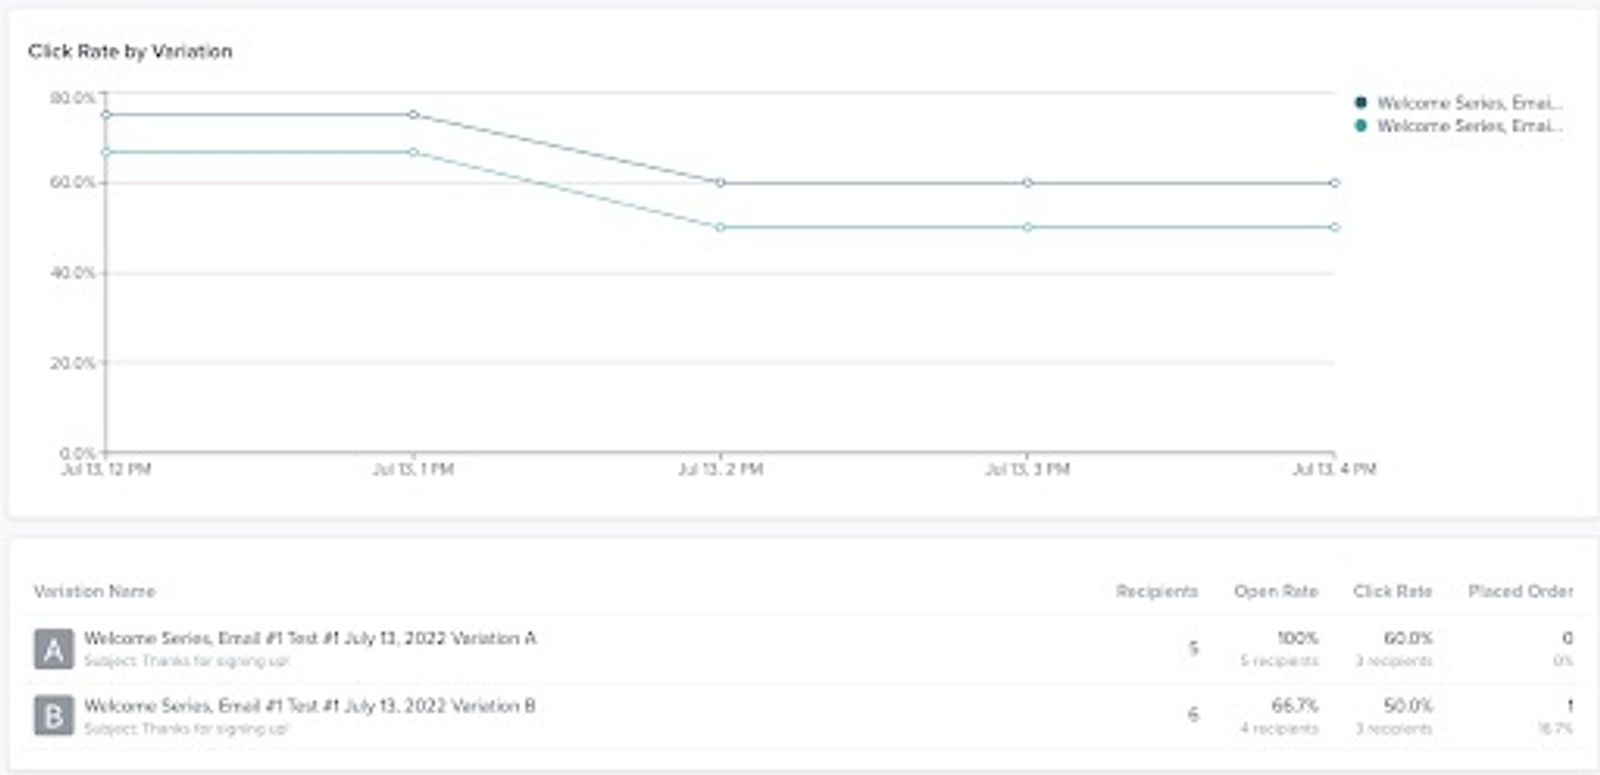
The following metrics are tracked for each variation:
- Deliveries
How many emails were delivered for the variation - Open Rate
The percentage of delivered emails opened, with the number of opens shown below - Click Rate
The percentage of delivered emails clicked, with the number of clicks shown below - Conversion metric
If available, a column named for the selected conversion metric. Depending on the metric, it shows the number of recipients who converted or the attributed value, with additional conversion details below.
The default conversion metric for most ecommerce integrations is Placed Order. If this is your selected metric, the table shows the attributed order value and the number of recipients who placed an order, rather than the placed order rate.
Open a variation’s row menu to Preview it or Save as Template. Saving as a template requires permission to edit templates.

Additional resources
- How to A/B test a flow email
Learn how to use Klaviyo’s A/B testing experience to test individual emails in a flow, including things like subject line, discounts, and email content, etc. You can even use A/B tests to determine if plain-text emails perform better than image-heavy HTML emails.
- How to A/B test an email campaign
Learn how to set up and run an A/B test for a campaign, how to read the test results, and a few use cases for A/B testing campaigns. Klaviyo's A/B testing feature for campaigns allows you to easily test different subject lines, message content, and send times so you can better understand what works best for your audience.
- How to A/B test a sign-up form
Learn how to use A/B testing to evaluate the performance of various elements of your sign-up forms. By effectively analyzing the results, you can ensure that your forms resonate with site visitors and contribute to list growth.