How to access your browser's developer console
You will learn
Learn how to access your browser's developer console, which is a tool standard to most modern web browsers that logs page errors and warnings. The developer console can be helpful for debugging technical issues.
The Klaviyo Support team may request additional information found in your browser's developer console to assist with troubleshooting. If you are asked for a screenshot or log from the developer console, follow the steps below to access this information in your browser of choice.
Open in Chrome
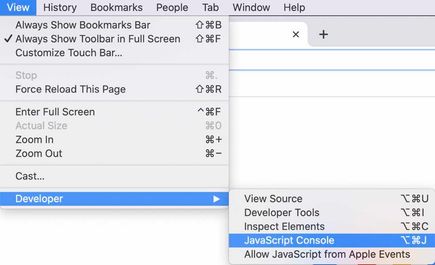
You can access the Chrome Developer Console from the Chrome menu bar:
- Open a Chrome window.
- From the Chrome menu bar, open the View menu.
- Select Developer > JavaScript Console to open the developer console.
You can also navigate to the JavaScript Console by opening the Inspect Element tab of the developer tools:
- Open a Chrome window and navigate to any webpage.
- Right-click on the web page within the browser window.
- Select Inspect.
- Navigate to the Console tab.
Alternatively, use the keyboard shortcuts Option + Command + J (Mac) or Control + Shift + J (PC) to open the console directly.
After you have successfully opened the Console tab, refresh the page or perform the action causing the technical issue and take a full screenshot of the results in the console window.
Open in Safari
Before you can access the developer console in Safari, you first need to enable the developer menu in your browser’s preferences.
- From the Safari menu bar, click Safari > Preferences.
- Select the Advanced tab.
- From the Advanced tab, click Show Develop menu in menu bar to enable easy access to the developer console.
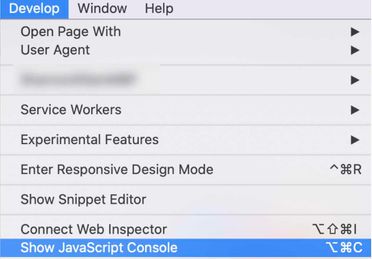
Once that menu is enabled, you can access the developer console from the menu bar:
- Open a Safari window.
- From the menu bar, click Develop > Show JavaScript Console.
Alternatively, use the keyboard shortcut Option + Command + C to quickly open the console directly.
After you have successfully opened the Console tab, refresh the page or perform the action causing the technical issue and take a full screenshot of the results in the console window.
Open in Firefox
- Open a Firefox browser window open.
- Click the menu button in the upper right corner.
- Select More Tools.
- From the available options, click Web Developer Tools.

The keyboard shortcut to open the Web Console in Firefox is Option + Command + K (Mac) or Command + Shift + J (PC).
After you have successfully opened the Web Console, refresh the page or perform the action causing the technical issue and take a full screenshot of the results in the console window.
You must use the Web Console, rather than the Browser Console when accessing this information in Firefox. The Browser Console logs warnings and errors across all tabs in your browser window and a screenshot of this console may contain information not relevant to the technical issue you are experiencing.
Accessing developer consoles in other browsers
Many browsers provide guidance on how to use their own developer tools. If you use a browser not included in the instructions above, we recommend searching your preferred browser’s documentation for more specific instructions.
Additional resources
- Troubleshooting sign-up forms
Learn troubleshooting tips for when a sign-up form in your Klaviyo account is not working as expected by reviewing common issues and solutions to these issues.
- Getting started with Klaviyo APIs
Get a foundational understanding of API calls and how the Klaviyo APIs can benefit your business. In this guide, you will learn about REST APIs, HTTP methods, and developer tools to prepare you for testing Klaviyo's APIs. Your first API calls can be accomplished in as little as 10 minutes from start to finish. If you are already familiar with API calls and are ready to test our APIs, follow our guide on how to use our Postman collections.