Getting started with the food and beverage business review dashboard
The food and beverage dashboard gives restaurants, cafes, and other food and beverage businesses an out-of-the-box view of how guests order, spend, reserve, and engage with your loyalty program without building a single custom report. This article explains how to access the dashboard, customize what you see, and understand each metric.
You will learn
- How to access your food and beverage dashboard
- How to filter and customize the dashboard
- What each section and metric measures, and how Klaviyo calculates it
- What to do when a section is empty or still loading
Common use cases
The food and beverage dashboard helps you answer questions like:
- How many orders and unique guests am I driving, and how is that trending over time?
- How much revenue are my guests generating, and what's the average spend per order?
- How are my reservations performing, and what's the average spend per reservation?
- How many loyalty rewards are my guests earning and redeeming?
- Which of my locations are performing best?
Before you begin
- The food and beverage dashboard appears automatically once your account has at least one restaurant or food and beverage integration installed. Supported integrations include Toast, Square, ChowNow, OpenTable, Olo, Thanx, and Punchh.
- You need a role with permission to view reporting (the same permission required to view other dashboards in Analytics).
The dashboard is built entirely from data your installed integrations send to Klaviyo. If you have integrations in more than one vertical (for example, a restaurant integration and a hotel integration), you'll see a separate dashboard for each.
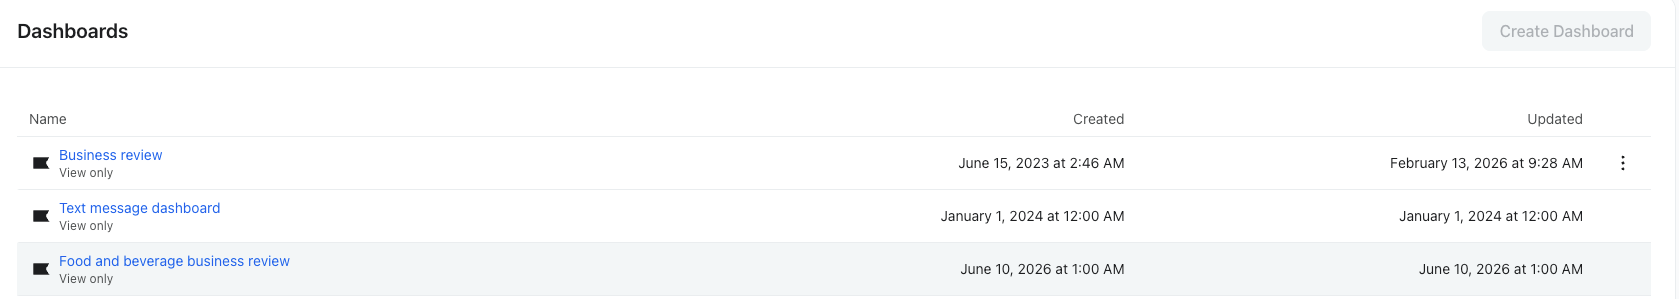
Accessing the dashboard
- Navigate to Analytics > Dashboards in your Klaviyo account.
- Find and click Food and beverage business review in your list of dashboards.
Note: Once the dashboard has been created for your account, it stays available even if you later remove the integration that triggered it. Your historical data remains so you don't lose access to your reporting.
Customizing the dashboard
A toolbar sits at the top of the dashboard with controls that apply across the whole page.
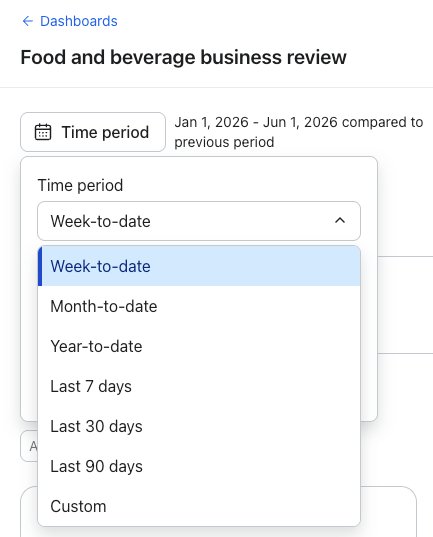
Set your time period
- Click the time period selector in the toolbar.
- Choose a preset — This week, This month, This year, Last 7 days, Last 30 days, or Last 90 days — or select Custom to set your own date range.
- Optionally set a comparison period to see how the current period stacks up against the previous one.
Filter by location
Most sections include a Location filter so you can focus on one or more of your locations (for example, a single restaurant or store). The filter is multi-select and searchable, which is helpful if you operate many locations.
- Click the Location filter, then search for and select the locations you want to include.
- Leave it set to All locations to see totals across your entire business.
- The location filter applies only to the section it sits in, so you can look at different locations in different sections at the same time.
Note: The Loyalty program section does not include a location filter.
Export to PDF
Click Export to PDF in the toolbar to download a snapshot of the dashboard. This is useful for sharing performance with stakeholders or saving a point-in-time record.
Note: The Export to PDF option is unavailable if you have read-only permissions.
Dashboard sections
The dashboard is organized into sections. You'll only see the sections and metrics that apply to the integrations you have installed. If you have more than one applicable integration for a section, Klaviyo uses the first one you installed in that category as the source for that section's data.
Overview
The Overview section is a quick, at-a-glance summary of your most important food and beverage metrics for the selected time period. It displays as a strip of key performance indicator tiles with the current date range shown above them.
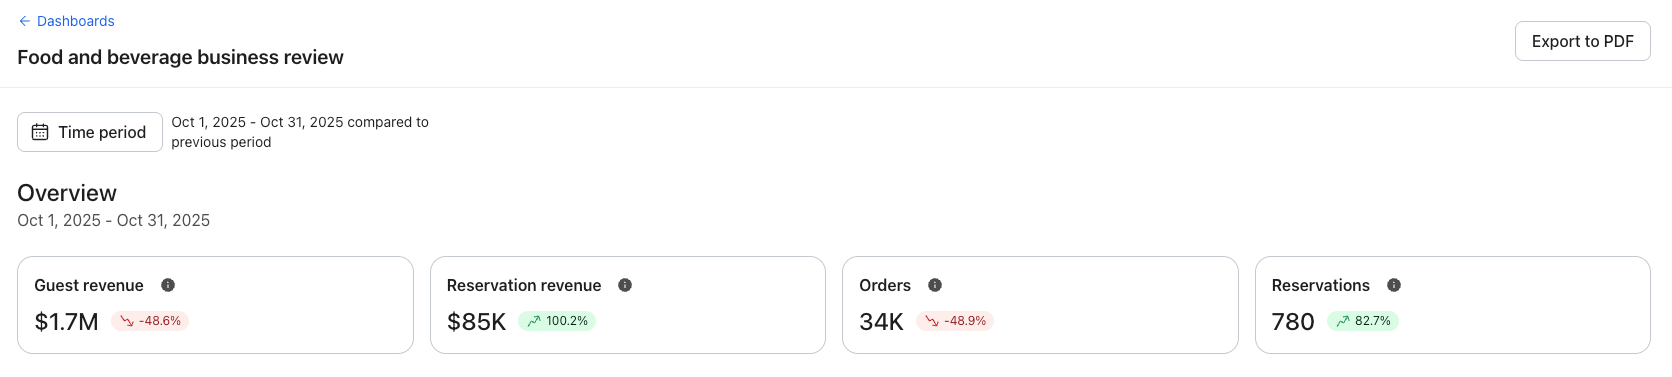
How we calculate your data
- Orders: The total number of Placed Order events from your guests.
- Guest revenue: The total revenue from your guests, summed from the value of their Placed Order events.
- Reservations: The total number of Confirmed Reservation events.
- Reservation revenue: The total revenue associated with your Confirmed Reservation events.
You'll only see the reservation tiles if you have a reservations integration (such as OpenTable) installed. If none of the Overview metrics apply to your account, the Overview section is hidden.
Guest metrics
The Guest metrics section helps you understand guest volume, behavior, and spend. It includes a Location filter, a strip of KPI tiles, and two trend charts that show how these metrics move over time.
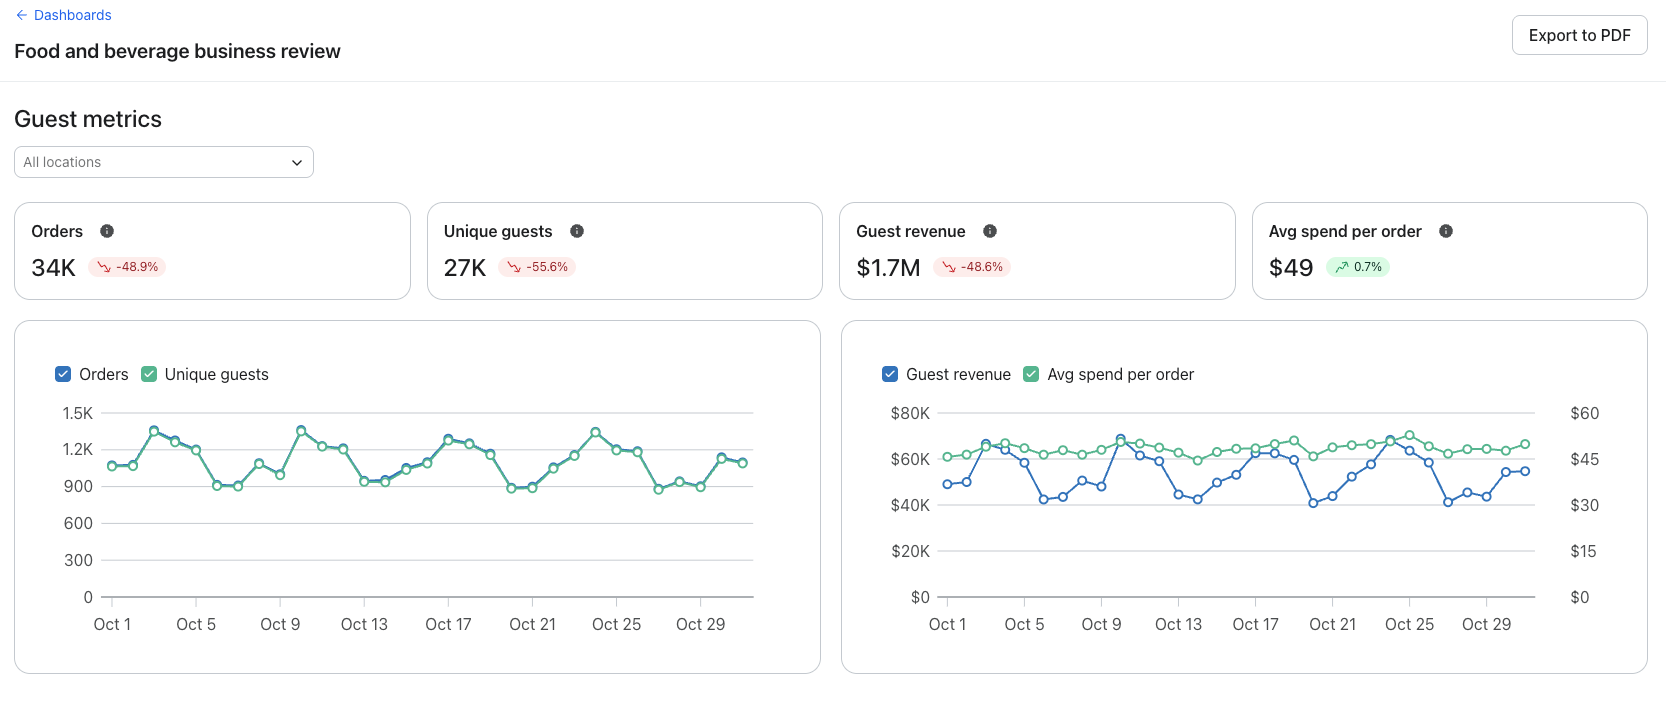
How we calculate your data
- Orders: The total number of Placed Order events from your guests.
- Unique guests: The number of distinct guests (profiles) who triggered a Placed Order event.
- Guest revenue: The total revenue from guests, summed from the value of their Placed Order events.
- Avg spend per order: Guest revenue divided by the number of orders.
Reservation metrics
The Reservation metrics section breaks down the revenue and volume of your reservations. It includes a Location filter, KPI tiles, and two trend charts.
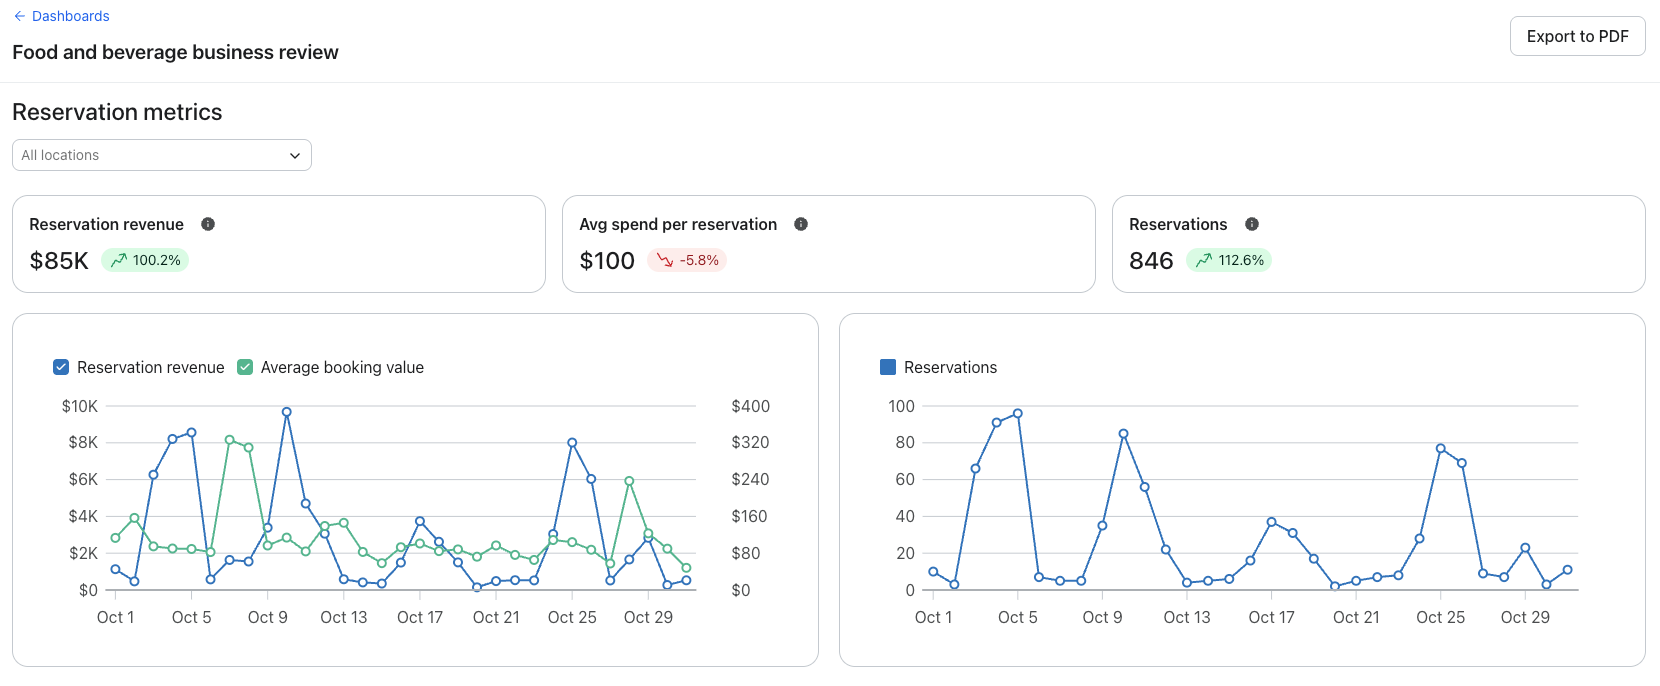
How we calculate your data
- Reservation revenue: The total revenue from Completed Reservation events.
- Avg spend per reservation: Reservation revenue divided by the number of completed reservations. This is shown on the trend chart as Average booking value.
- Reservations: The total number of Completed Reservation events.
Note: This section is powered by your reservations integration (such as OpenTable). If you don't have one connected, you'll see a prompt to connect one.
Loyalty program
The Loyalty program section shows how guests engage with your loyalty program. It includes KPI tiles and a Loyalty program performance chart. This section has no location filter.
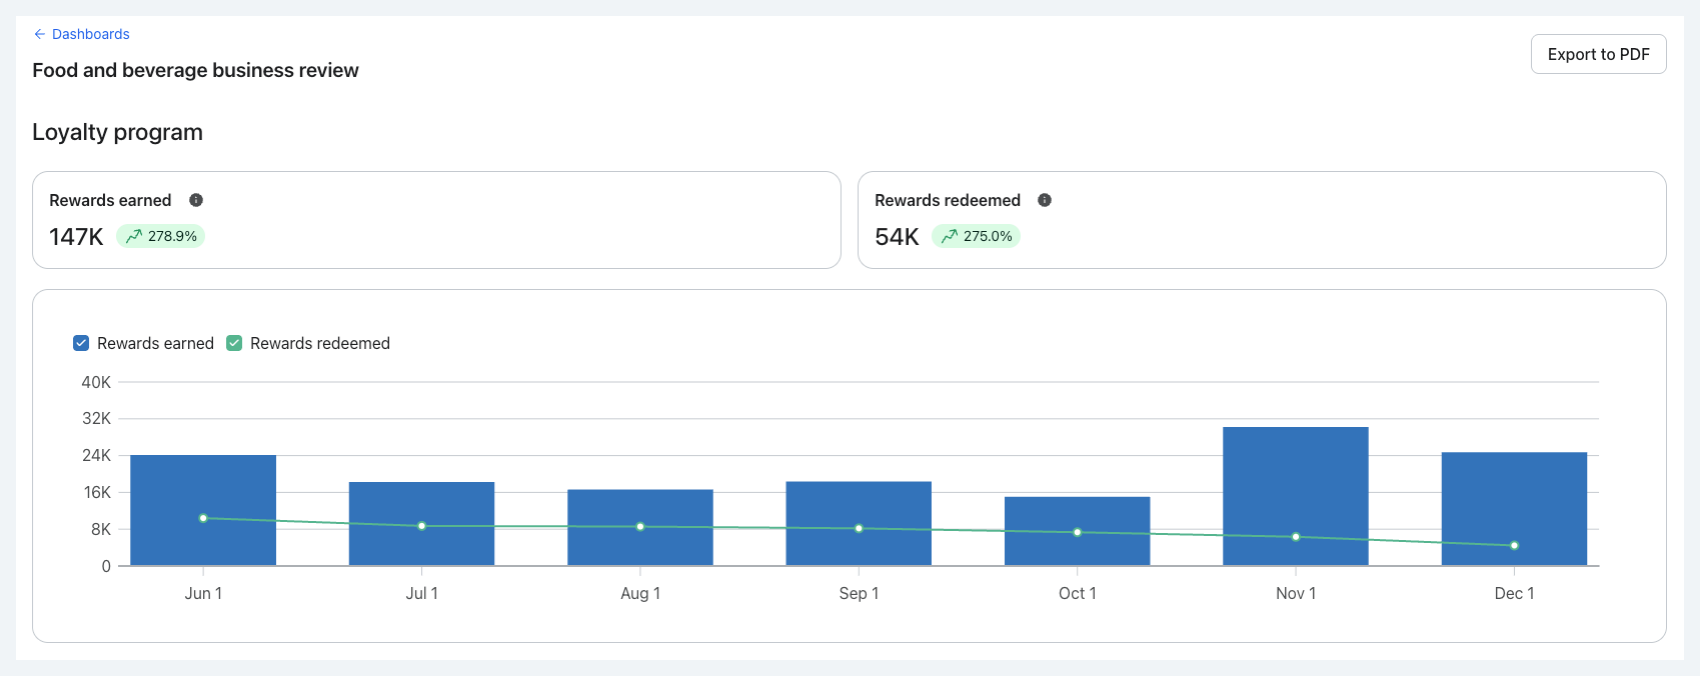
How we calculate your data
- Rewards earned: The total number of Earned Reward events.
- Rewards redeemed: The total number of Applied Redemption events.
Note: What the chart shows depends on your loyalty integration. Some integrations report only rewards earned, while others report both rewards earned and rewards redeemed.
When a section is empty
If a section needs an integration you haven't connected yet, you'll see a prompt to connect one. Click Add app to go to the integrations directory, or Dismiss to hide the prompt for that section.

If you've connected an integration but data hasn't arrived yet, you'll see a No data yet card with the message "Data will appear once it becomes available." This is expected right after connecting — data populates as your integration syncs events into Klaviyo.
Frequently asked questions
Why don't I see the food and beverage dashboard?
The dashboard only appears once your account has a supported restaurant or food and beverage integration installed (Toast, Square, ChowNow, OpenTable, Olo, Thanx, or Punchh). If you've just connected one, give it some time to sync and refresh the Dashboards page.
I have multiple integrations installed. Which one does each section use?
For any section where more than one of your integrations applies, Klaviyo uses the first one you installed in that category. For example, if you installed Toast before Square, your guest and spend metrics are based on Toast data, while a separate integration like OpenTable powers your reservation metrics.
Why is a metric or tile missing?
Tiles only appear when you have an integration that supplies the underlying metric. For instance, the reservation tiles require a reservations integration, and the loyalty tiles require a loyalty integration. If the relevant integration isn't connected, that tile or section won't show.
Does the location filter affect the whole dashboard?
No. The Location filter applies only to the section it appears in. You can filter Guest metrics to one location while leaving Reservation metrics on all locations.
Will my data disappear if I remove an integration?
No. Once your dashboard is created, it stays available and your historical data is retained, even if you uninstall the integration that originally enabled it.
Can I change my time period for just one section?
No. The time period applies to the entire dashboard. The Location filter is the per-section control.